Introduction
Metabolomics has become an important trend in modern clinical research, involving in particular a comprehensive analysis (identification and quantitative measurement) of human physiological state metabolic markers. Among the common approaches used in metabolomics, metabolic profiling plays an important role, being defined as a quantitative analysis of metabolites that belong to a single chemical class of substances or a specific biochemical pathway [1]. Special attention in metabolic profiling is paid to identification and quantitative measurement of lipids of a biological object.
Lipids are known to form building blocks for all cell membranes, performing structural-regulatory function that allows cells to maintain the constancy of their inner medium. Secondly, many fats or their derivatives are important players in the regulatory signal transfer chains, determining the so-called regulatory-signaling function of lipids in the body [2].
The fatty acids, as a part of the lipid group are found to determine the liquid crystal properties and permeability of cell membranes. The composition and chemical structure of fatty acids are diverse. There are saturated, monounsaturated (MNFA) and polyunsaturated (PUFA) fatty acids. The degree of saturation of a fatty acid is determined by the number of double bonds between carbon atoms in its molecule. If all the bonds in the molecule are single, then the fatty acid is classified as saturated. Monounsaturated fatty acids contain one double bond; polyunsaturated fatty acids contain two or more double bonds, respectively.
Polyunsaturated fatty acids play an important role in maintaining the fluidity of biomembranes. Number of polyunsaturated fatty acids are precursors of eicosanoids (prostaglandins and leukotrienes), which are involved in signaling biochemical pathways in almost all human organs and tissues [3].
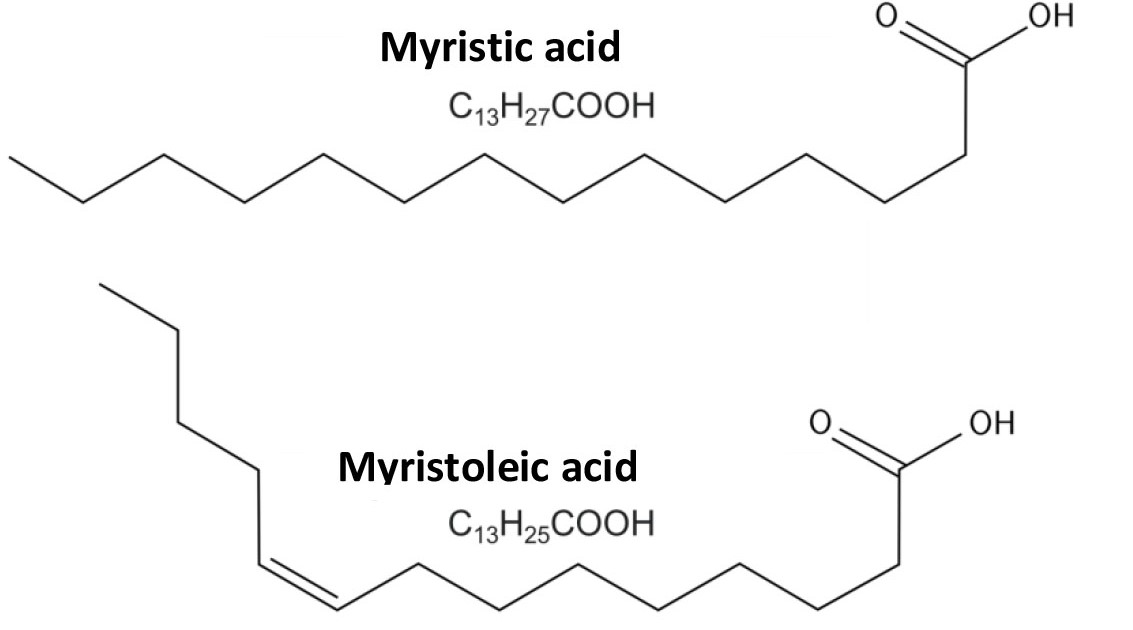
Fig. 1. Myristic (saturated fatty acid) and myristoleic (monounsaturated acid).
Based on the number of the carbon atoms (counted – from the terminal methyl group), involved in formation of the last double bond, there are three groups of unsaturated fatty acids, which in turn are divided into subgroups: monounsaturated fatty acids, in particular omega-9 acids (these acids do not belong to the group of essential acids and the most prominent representative is oleic acid (C18:1)) and a subgroup of polyunsaturated fatty acids: omega-6 (gamma-linolenic (C18:3), di-Homo-gamma-linoleic (C20:3) and arachidonic (C20:4) acids), as well as omega-3 acids (eicosapentaenoic (EPA) (C20:5), docosapentaenoic (C22:5) and docosahexaenoic (DHA) (C22:6) acids [3, 4].
Polyunsaturated fatty acids play vital role for human health. Only some of them can be endogenously synthesized in cells from saturated fatty acids, however, for lack of enzymes in human body that catalyze formation double bonds beyond the 9th carbon atom (from the carboxylic residue), most polyunsaturated fatty acids are irreplaceable [4].
The main sources of polyunsaturated fatty acids is vegetable oil, fish, seafood, egg yolk and other foods. [5, 6]. As an example, eicosapentaenoic and docosahexaenoic acids (from omega-3 group) in only a small amount (8% and 0.1-9%, respectively) can be naturally formed in the human body from alpha-linolenic acid, that is abundantly present in linseed oil, canola rapeseed, non-hydrogenated soy oil [7]. Therefore, to date, these acids are considered essential components of the human diet [8, 9].
Evaluation of the omega-3 acids level is getting increasingly used as it is often considered an indicator associated with cardiovascular disease risk [10]. The numerical indicator of omega-3 acids level is omega-3 index, which is calculated as the percentage of eicosapentaenoic and docosahexaenoic polyunsaturated fatty acids from the total amount of fatty acids in the blood. The reference values of the index are linked to cardiovascular disease risk as follows: if the omega-3 index is <4%, the risk of cardiovascular diseases is high, while at the index >8% – the risk is low.
To assess the nutritional status of a human, it is necessary to monitor the main unsaturated fatty acids of the omega-6 family of acids, which are complimentary risk prognosis markers of cardiovascular diseases. The main acid of the omega-6 group is linolenic acid, which comes from food, mainly with vegetable oils. Linoleic acid can then be converted to other unsaturated fatty acids, such as gamma-linolenic acid or di-Homo-gamma-linolenic acid, which in turn can be converted to arachidonic acid – a well-known precursor of many metabolically active compounds (prostaglandins, thromboxanes, leukotrienes, etc.). Arachidonic acid also belongs to the omega-6 family of acids. It is also worth noting that numerous studies have shown that omega-6 acids have a cholesterol-lowering effect, leading to reduced risk of cardiovascular diseases.
To assess the balance of omega-6 fatty acids in the human diet, a method is used to assess their relationship to omega-3 acids. According to the literature, the recommended proportions should be between 1:1 and 4:1. However, following the industrial revolution, the composition of the human diet changed rapidly: saturated fatty acids began to predominate, and thus the ratio of omega-6/omega-3 acids also increased to 20-30:1. This change in diet is believed to result in recent growth of cardiovascular diseases. Based on these ideas, many nutritionists recommend a diet with a ratio of omega-6/omega-3 fatty acids of about 2:1, having this ratio achieved by increasing omega-3 fatty acids.
Gas chromatography-mass spectrometry method is excellent tool to quantitate fatty acids in human blood. The sensitivity and selectivity of the method become great advantage for analysis of complex biological samples, where strong influence of matrix interfering components impedes reliable quantification of target analytes.
Experimental
Materials and methods
Hexane, methanol, concentrated hydrochloric acid (37%), tridecanoic acid used in the experiment were all classified as particularly pure or were “HPLC grade”. At derivatization step, an esterification reaction (methanol) was used to form fatty acid methyl esters using an acidified methanol solution (1,2 M HCl/MeOH). The internal standard was the carbon-isotope-labeled tridecanoic acid (13 C) standard. As a set of standard substances, a commercial mixture of fatty acid methyl esters (Nu-Chek-Prep GLC-Nestle36, USA) was used, the purity of each individual substance being at least 99%.
Blood samples obtained from a clinical laboratory collaborator were used for method development and evaluation. Each blood sample was collected under written testee’s consent and delivered anonymous with only gender and age indicated. In cases when instant analysis was not possible, blood samples were fresh frozen and stored at a temperature of -18°C. Blood is the best to monitor fatty acids due to its low biological variability. In particular, unlike plasma, the content of EPA and DHA acids in the blood is not diluted if a person has taken some food that does not contain them. Besides, the blood samples are stable for up to seven days at room temperature in a test tube with EDTA [11].
The parameters of the GC-MS system and the instrumental method parameters are listed in Table 1.
Table. 1. The parameters of the instrumental method.
| Instrument | |
| GC-MS system model | Q-Tek GC-MS |
| inlet | Split/Splitless (liner: Trajan 4 mm x 6.3 x 78.5) Split, straight-through liner (Trajan cat # 092007) |
| GC column | Trajan cat # 054101 BP5X 5% Phenyl Polysilphenylene-siloxane 30m 0.25mm 0.25um |
| Method parameters | |
| Injected Sample volume | 1,0 uL |
| Inlet mode | Split 10:1 |
| Inlet temperature | 270°C |
| Carrier gas flow mode | Constant Flow |
| Oven program | 60°C hold 3,0 min;
30,0°C/min to 190°C, hold 0,0 min; 2,0°C/min to 250°C, hold 0,0 min; 30,0°C/min to 300°C, hold 0,0 min; |
| Carrier gas flow and type | (He) 1,0 mL/min |
| GC-MS transfer line temperature | 270°C |
| Detector settings | |
| Ion source | EI |
| Ion source temperature | 230°C |
| Solvent delay | 6,8 min |
| Data Acquisition mode | SIM (see below) |
| Dwell Time | Automatically calculated by iDwell® Time |
General procedure for measuring FA in biological samples
Good separation of lipids from other components of the blood sample is essential. To achieve that, 100 µl of blood was placed in a 2 ml autosampler vial, then 400 ml of acidified methanol with ISTD was added. The resulting mix was shaken intensively on a shaker for 1 minute, prior to acid hydrolysis with methanol (80°C, 45 min) [12].
Afterwards, the released components were separated from the sample matrix by hexane extraction. 400 µl of hexane was added to the derivatized mixture, the mixture was placed on a shaker, then put to rest for 5 minutes to separate layers. An aliquote of the upper layer was taken for GC-MS analysis on Q-Tek GC-MS system. The list of 34 target compounds and ISTD along with their Retention Times and respective structural characteristic ions was put together to populate SIM table.
Discussion of the analysis procedure
A mix of fatty acid methyl esters (FAME) standards with concentrations of at least 10 ppm each component was run is full scan mode in range from 50 to 450 Da to optimize parameters of GC separation method, record the compounds retention times, extract clean spectrum. Next, SIM method was automatically generated from full-scan data, SIM table populated with time segments and importantly, unique iDwell°Time algorithm was activated to optimize scan time for all target structural characteristic fatty acid ions in SIM mode. The outcome of the algorithm job is shown in figure 2.
The iDwell°Time algorithm allows an analyst to achieve best sensitivity of the instrumental method by optimum scan time for each ion. The resulting peaks have improved shape and possible loss of ion current during the experiment is much reduced. An example of the resulting mass chromatogram is shown in figure 3.
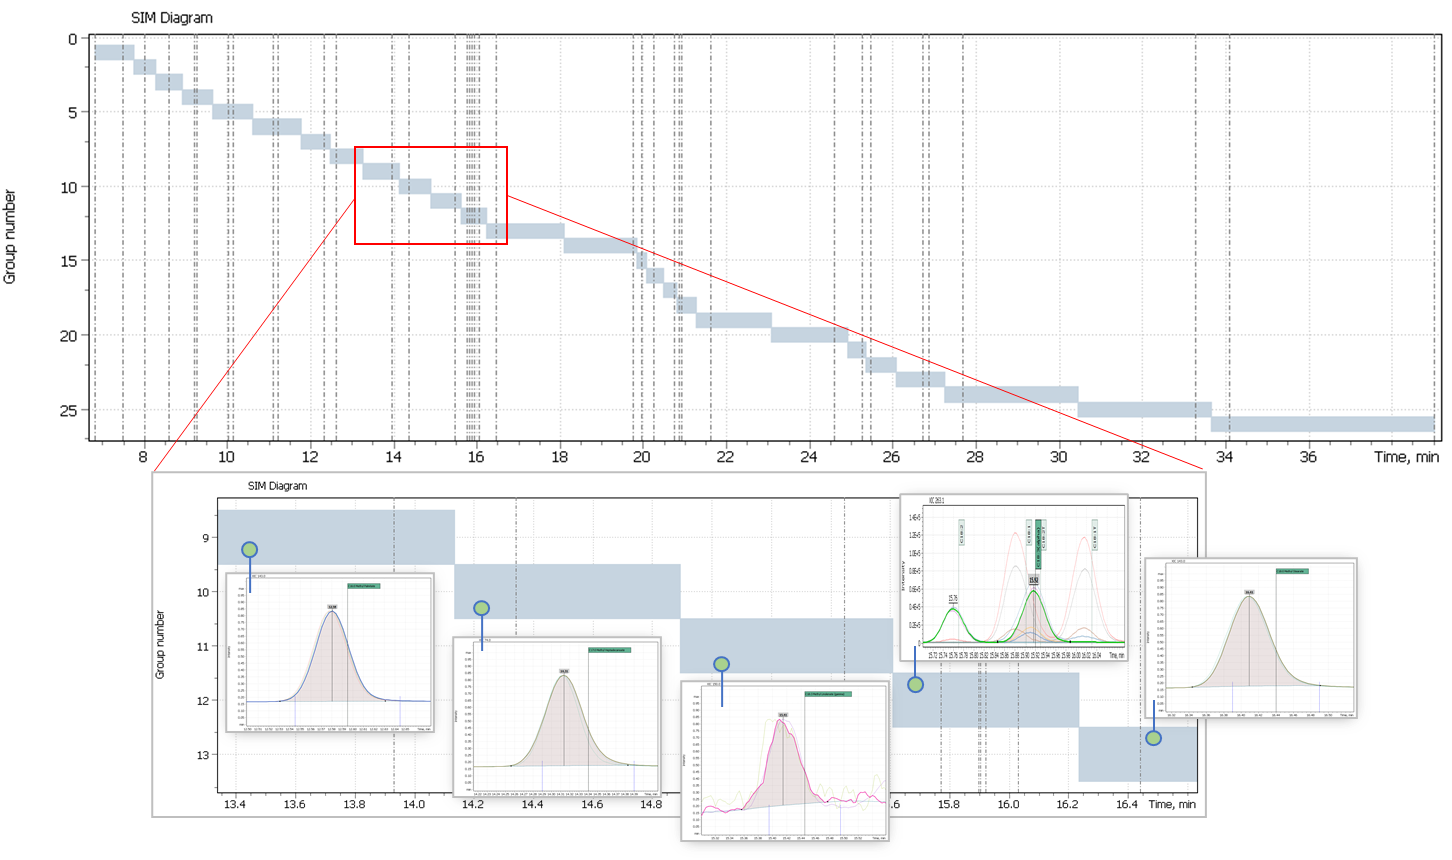
Fig. 2. Results of the algorithm iDwellTime
Fig. 3. Chromatogram of FAMEs mix, at their concentration ≈ 1 ppm (SIM). All mass peaks of target compounds have ideal shape due to optimal scan time offered by unique iDwell®Time algorithm.
The iDwell®Time algorithm enabled approach to optimal detection for each ion leads to a superior quantitative capability of the instrumental method. Besides the bulk assessment of the target omega-3 acids (EPA (20:5 n-3) and DHA (22:6 n-3)), it allows quantification of all 32 fatty acids during a single chromatographic analysis (figure 4): saturated (10:0, 11:0, 12:0, 13:0, 14:0, 15:0, 16:0, 17:0, 18:0, 20:0, 21:0, 22:0, 22:0, 24:0); CIS-monounsaturated (14:1, 15:1, 16:1, 17:1, 18:1, 20:1, 22:1, 24:1); TRANS-unsaturated (18:1T, 18:2T); CIS-n-6 polyunsaturated (18:2, 18:3(n-6), 20:2, 20:3, 20:4, 22:4, 22:5); CIS-n-3 polyunsaturated (18:3 (n-3)).
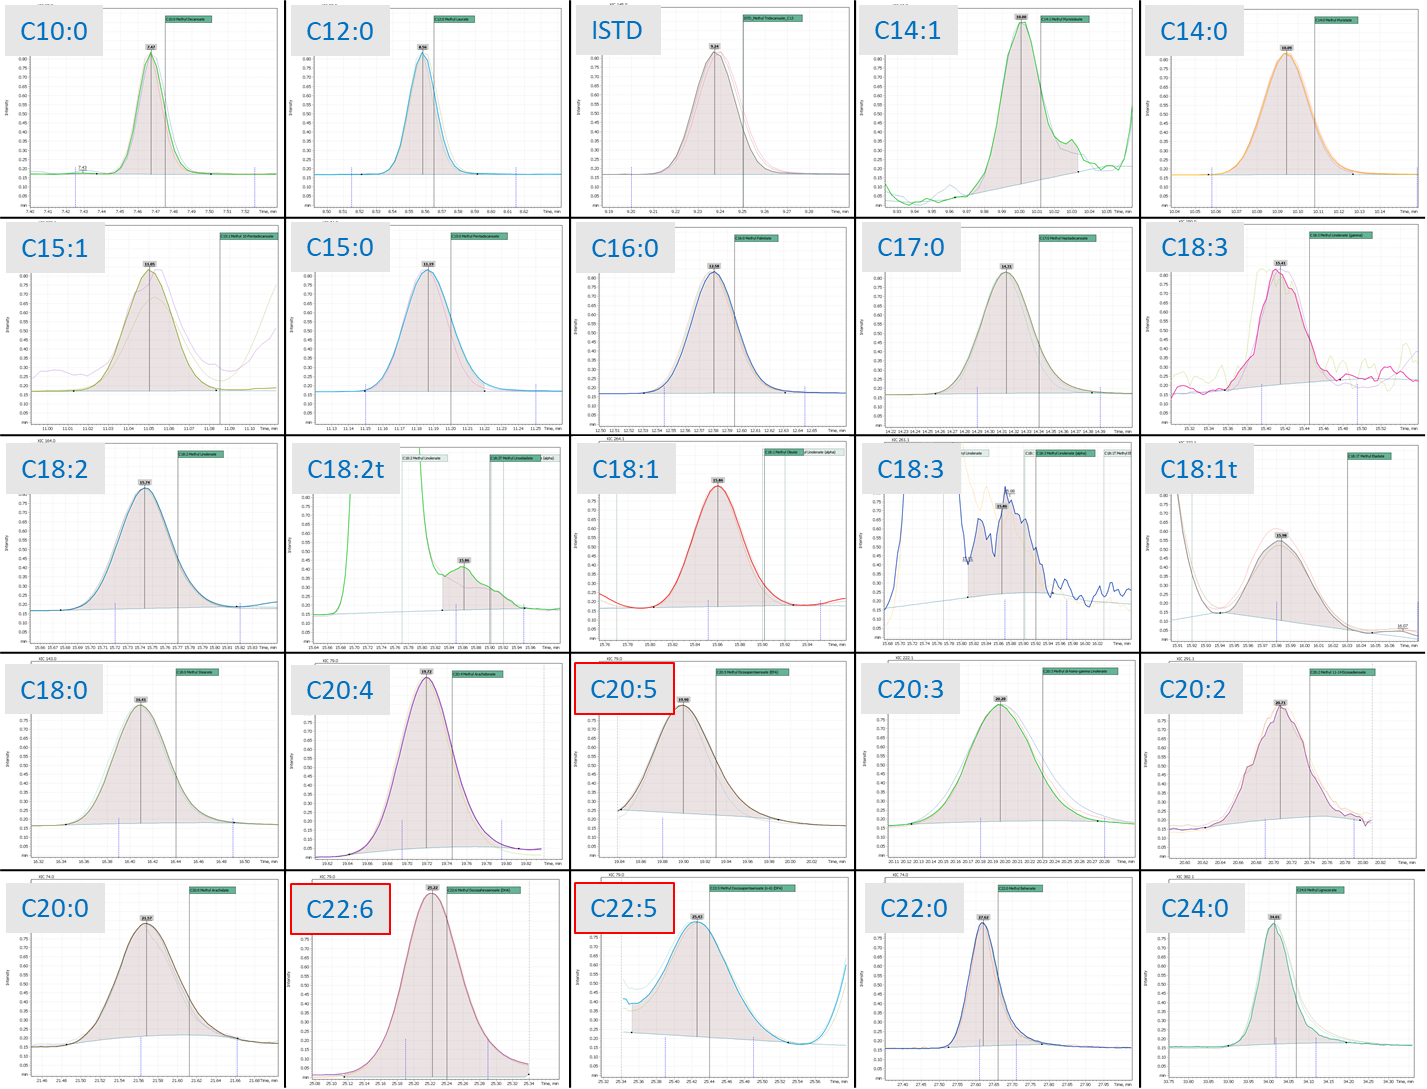
Fig. 4. Example of quantitative analysis of a set of fatty acids, FAMEs peak integrated by “Q-Tek Analyst» software.
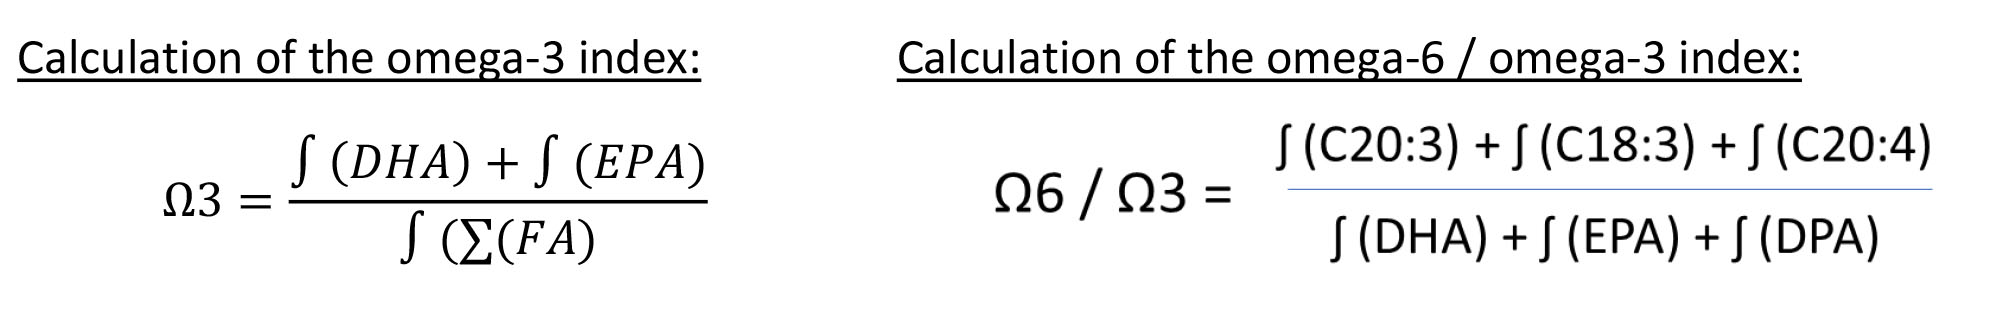
Thus, the total integrated peak area for all detected fatty acids determines the total contents of fatty acids in the blood (ΣFA). The omega-3 index is calculated as the percentage of integrated peaks of both eicosapentaenoic (EPA) and docosahexaenoic (DHA) polyunsaturated fatty acids to total integrated peak area for all fatty acids in the blood. The omega-6/omega-3 fatty acid ratio index is calculated as the total integrated peaks of omega-6 acids to the total integrated omega-3 acids peaks.
- It is worth noting that having all FAME peaks integrated individually opens up additional possibilities for calculating such indicators as:
- To calculate the ratio of polyunsaturated fatty acids to saturated fatty acids (PUFA: NFA). It is a universal marker of lipid metabolism disorders and a predictive indicator of cardiovascular diseases.
- To calculate TRANS-fatty acid-to-fatty acid ratio as a predictive heart disease risk indicator, HDL and LDL balance.
- To calculate ratio of arachidonic to eicosapentaenoic acid. Diagnostic marker for estimation of pro-inflammatory effect of eicosanoids and cytokines; high index values indicate the likelihood of pain due to inflammatory processes.
Practical assessment of the method’s applicability
During the testing of the analytical method for determining the omega-3 and omega-6/omega-3 indices in blood by GC-MS, 62 patients (men-24, women – 39) of average age from 25 to 60 years were examined. In the study, it was noted the average value of the omega-3 index for most patients was from 7 to 9 (average 8.25), the values of the omega-6/omega-3 index were most often from 2 to 3 (average 2.38).
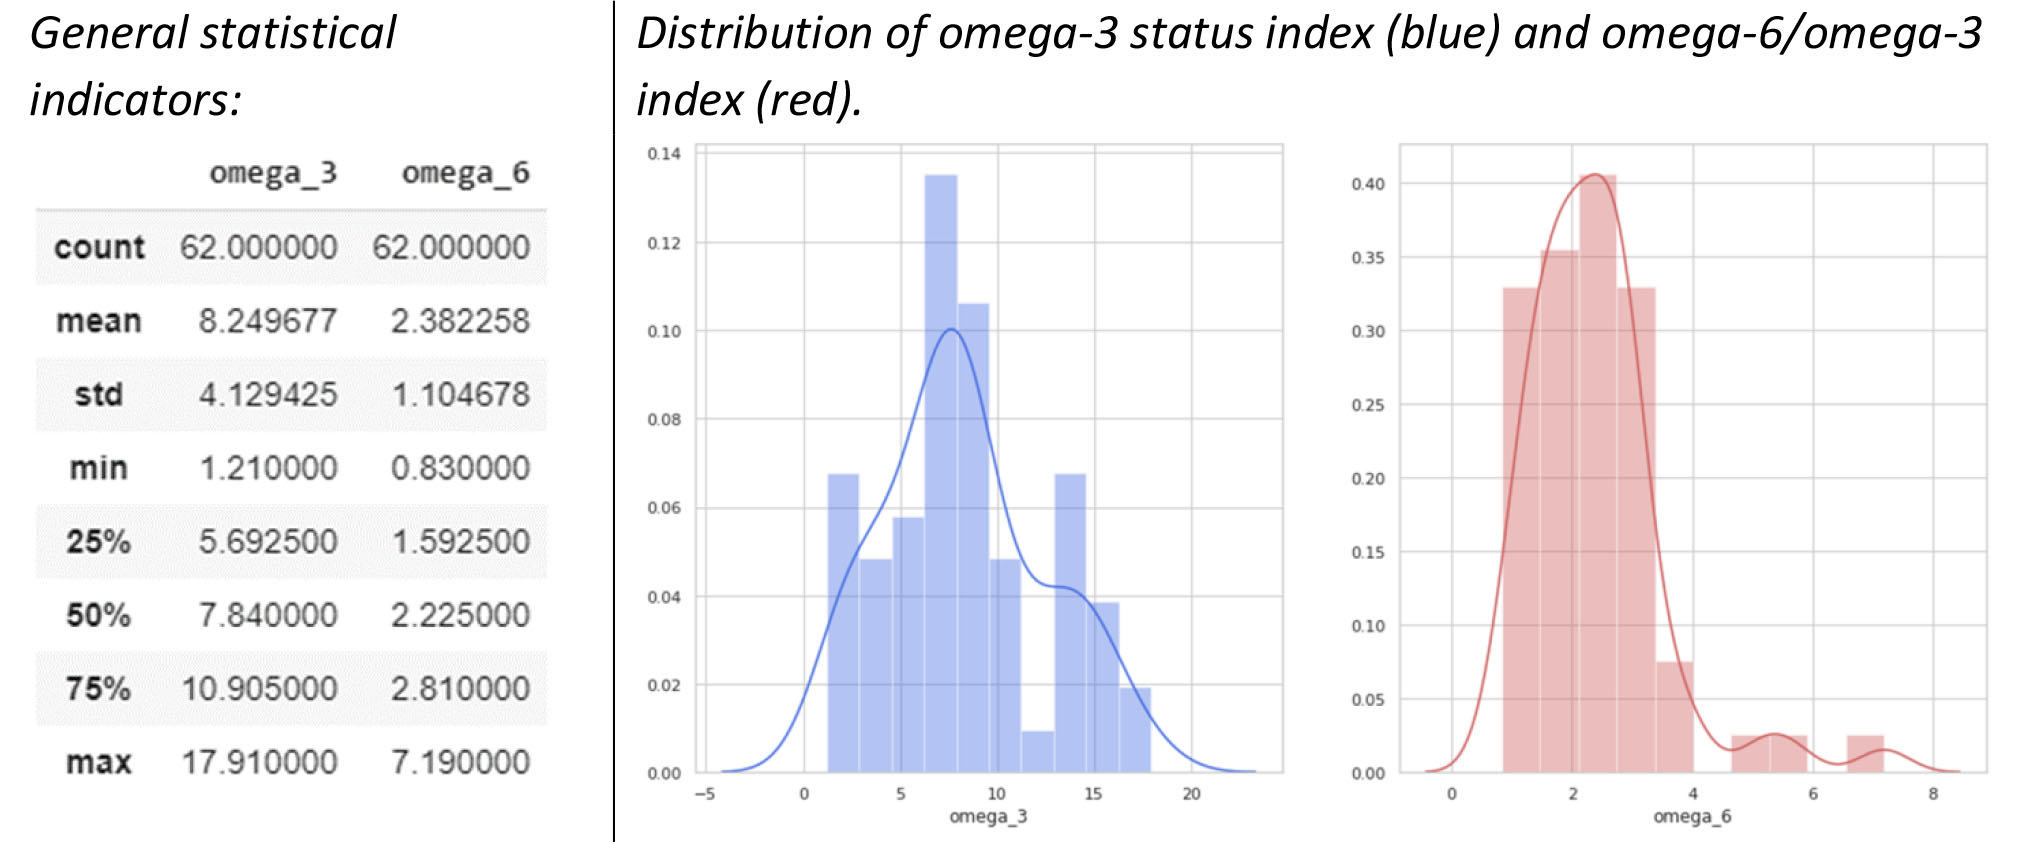
Fig. 5. Overall statistical indicators for 62 patients, as well as the distribution of omega-3 and omega-6 indices.
The obtained resulting indices are consistent with the expected values, correlate well with the both literature sources [11], and general recommendations on monitoring omega-3 and omega-6 ranges published elsewhere.
The main omega-3 acids signals at different calculated index values are shown in fig.6. The peak integrator algorithm built into Q-Tek-Analyst GC-MS data processing software ensures reliable integration of trace analyte peaks adjacent with high matrix interfering peaks.
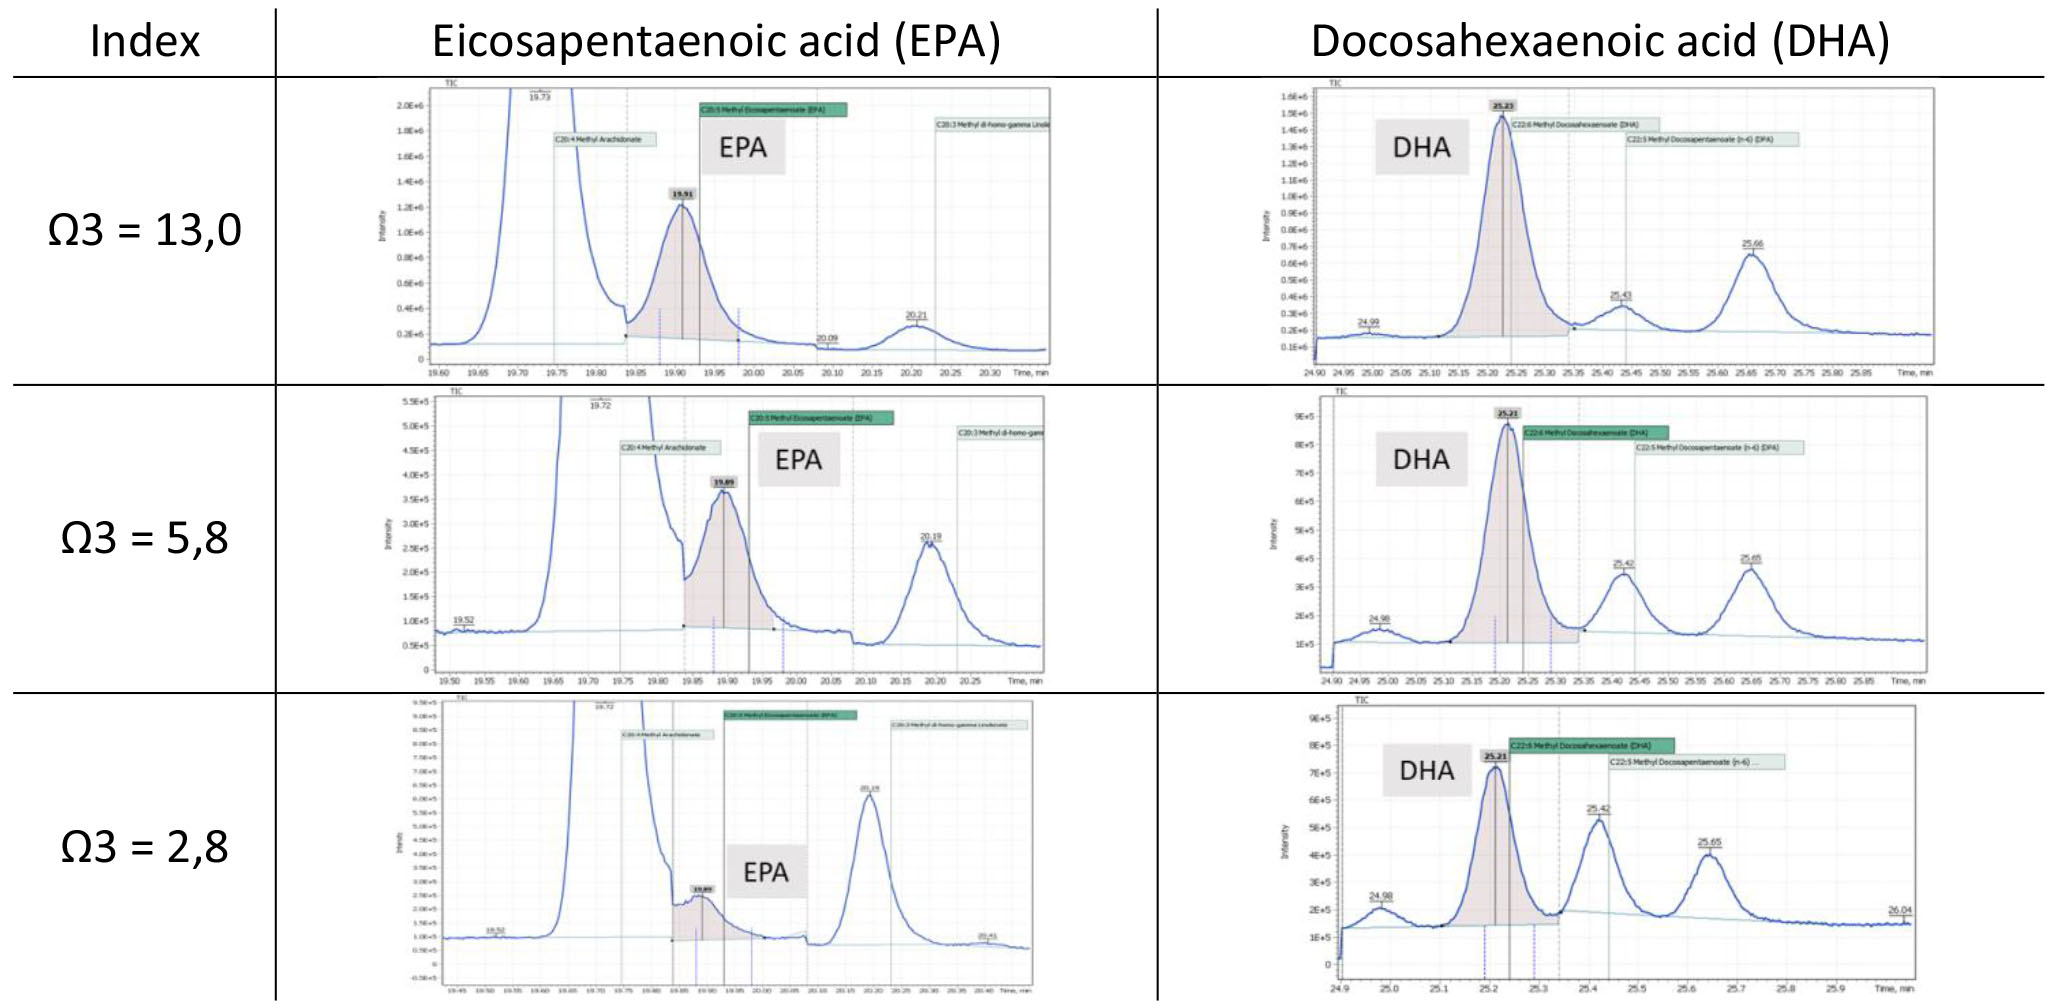
Fig.6. Signals of the main omega-3 acids at different index values
The use of individual peak integration data allows us to model correlation between the omega-3 and omega-6 indices. In particular, figure 7 shows a linear plot with a correlation coefficient of 0.76 (obtained from data of 62 patients). One can see the majority of those patients having the omega-3 index within the norm (7-8), have ratio of omega-6/omega-3 acids also within the expected target value (2 – 5).
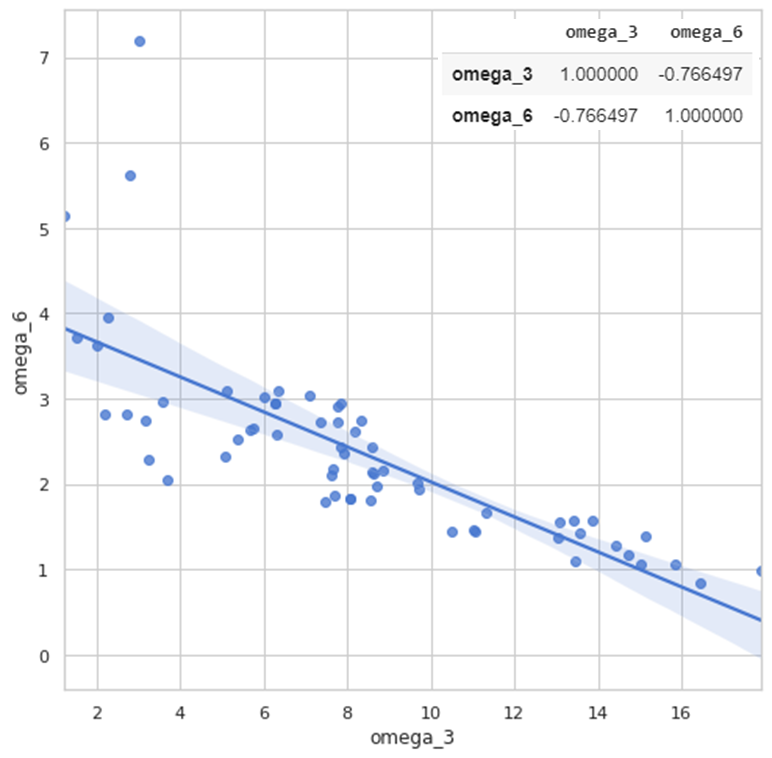
Fig. 7. Correlation curve for the ratio of omega-3 and omega-6 indices.
The results showed that to determine the qualitative and quantitative composition of fatty acids in human blood, it is necessary to apply a detailed analysis using the gas chromatography-mass spectrometry method. Timely monitoring of the omega-3 and omega-6 acid indices is important in ensuring the normal physiological status of a person. The GC-MS data can provide complimentary information and an early message to a doctor in case of metabolic or nutritional distortion.
Conclusions
Omega-3 and omega-6/omega-3 indices are available, fairly accurate, easily reproducible indicators and might be used in certain clinical practice. Level of omega-3 index greater than 8% is associated with minimal cardiovascular risk and would be typical of most people.
The GC-MS method developed on Q-Tek mass-spectrometric system demonstrated excellent performance to be suitable for routine monitoring of omega-3 index in human.
The easy-to-read automated report (fig.8) was designed to improve the method usage as a turn-key solution by a clinical research labs not proficient in GC-MS technique. The report indicates omega-3 index value, ratio of omega-3/omega-6 indices and concentration values of individual fatty acids that could be of most interest to a researcher or nutritionist.
The complimentary information it provides to a doctor or nutritionist may result in more accurate and effective therapy or diet correction.
Besides, it may facilitate other on-going larger-scale correlation studies between level of fatty acids in blood and human health.
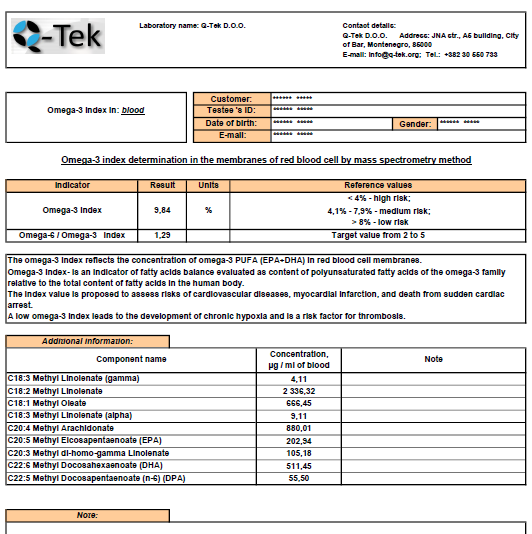
Fig 8. Automated report on omega-3 index determination by Q-Tek GC-MS
Further studies have also demonstrated excellent performance of this method for omega indices calculation from dried blood spot (DBS) samples. The results are to be published soon.
References
- Лохов П.Г., Арчаков А.И. Масс-спектрометрические методы в метаболомике // Биомед. химия. 2008. 54(5): 409–511.
- Татьяна Павловна Новгородцева, Липидомика в медико-биологических исследованиях НИИ Медицинской климатологии и восстановительного лечения // Здоровье. Медицинская экология. Наука. 4-5 (39-40) 2009, УДК [612.123+61+57]:001.8
- Бурбелло А.Т. Омега-3 полиненасыщенные жирные кислоты. Фармакология, клиническое применение. – СПб, 2005 – 303с.
- Титов В.Н. Атеросклероз – патология полиеновых жирных кислот // Клиническая лабораторная диагностика. – 2001. – № 1 – С. 3 – 9
- Левачев М. М. Значение жира в питании здорового и больного человека: справочник по диетологии. – М.: Медицина, 2002. – С. 25-32.
- Norum K. R. Dietary fat and blood lipids//Nutr. Rev. – 1992. – Vol.50, №4, Suppl. 2. – P.30-37.
- International Omega-3 learning and education consortium for health and medicine. University of Connecticut 2007-2012. http://www.omega31earning.uconn.edu/library/
- Lavie CJ, Milani RV. Fish oils. In: Messerli FH, editor. Cardiovasc Drug Therapy. Philadelphia: Saunders, 1996. – P. 1608-13
- Pauwels E.K. The protective effect of the mediterranean diet: focus on cancer and cardiovascular risk // Med Princ Pract. – 2011. – Vol.20, №2. – P. 103-111.
- Chowdhury R, Warnakula S, Kunutsor S, Crowe F, Ward HA, et al. (2014) Association of dietary, circulating, and supplement fatty acids with coronary risk: A systematic review and meta-analysis. Ann int med 160: 398-406.
- Жуков А.Ю., Ворслов Л.О., Давидян О.В. Омега-3 индекс: современный взгляд и место в клинической практике. Вопросы диетологии. 2017; 7(2): 69-74. DOI: 10.20953/2224-5448-2017-2-69-74
- Brondz, I., Development of fatty acid analysis by high-performance liquid chromatography, gas chromatography, and related techniques. Analytica Chimica Acta, 2002. 465: p. 1-37.