Introduction
The integration of chromatographic signal is the first and important step in post- experimental data processing. Detection of peaks along with their intensity, area, and retention time elucidate their main qualitative and quantitative characteristics. In particular, the area of a detected peak can be correlated with the peak area of relevant analytical standard or be used for building calibrations, while measured retention time of compound peak allows an operator to set up expected elution time window for a given compound on the chromatogram in a GCMS method.
 Chromatographic signals are usually integrated with help of automatic peak detection algorithm running behind GC-MS software user interface. At the same time, during each study use of a chosen integration method is mandatory, both for all peaks on a chromatogram of a single sample, and for all analyzed samples in the batch [1-3]. The role of an analyst in the data processing is to chose appropriate values of the integrator parameters: e.g. setting sensitivity of the algorithm to slope of the baseline, setting the baseline threshold, the expected peak width, the threshold value of signal area, along with some other parameters. The analyst is expected to make correct and scientifically sound judgments when choosing peak integration parameters.
When all target peaks on a single chromatogram are baseline separated, a uniform and consistent peak integration is an easy task to run automatically. However, same task may turn into a real challenge in complex biological matrices, and furthermore in the case of running multicomponent analyses. Working with samples of urine, blood, and plant extracts, the analyst often needs to double-check the previously accepted automatic integration patterns and, if necessary, make adjustments within a single experiment. At the same time, high concentrations of target compounds will not let one rest assured of automatic peak integration correctness especially, as previously noted, if several dozen target compounds are monitored in the method. To illustrate the above statements the Human Microecological Status Assessment by Chromatography-Mass Spectrometry Method [6] was taken. The method is used for fast detection and identification of selected microbes in human tissue and biological fluids and also makes it possible to quickly derive information on inflammation markers and facilitate diagnosis of possible infections. Quantitative evaluation of microbial markers requires high consistency, and therefore, highly uniform integration patterns must be applied to process chromatography-mass spectrometry data. The latter can be quite difficult considering variety of analyzed matrices.
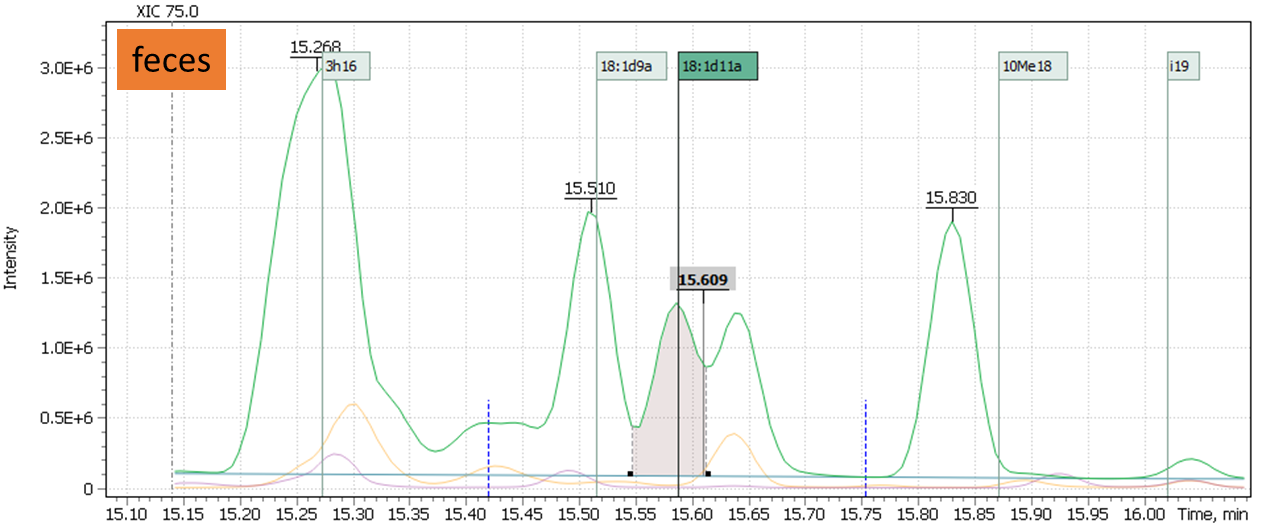
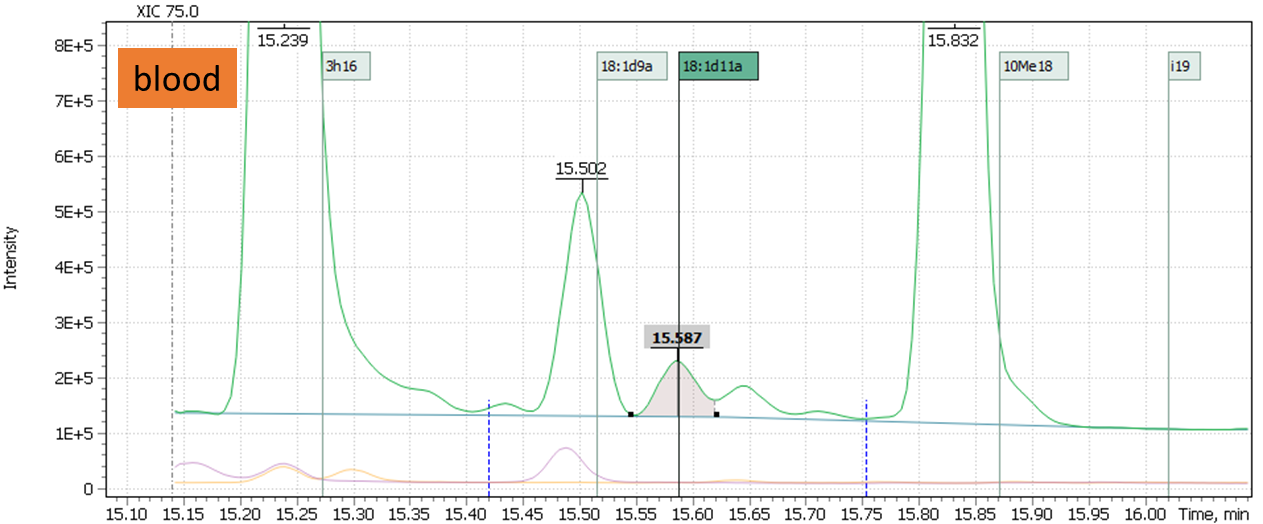
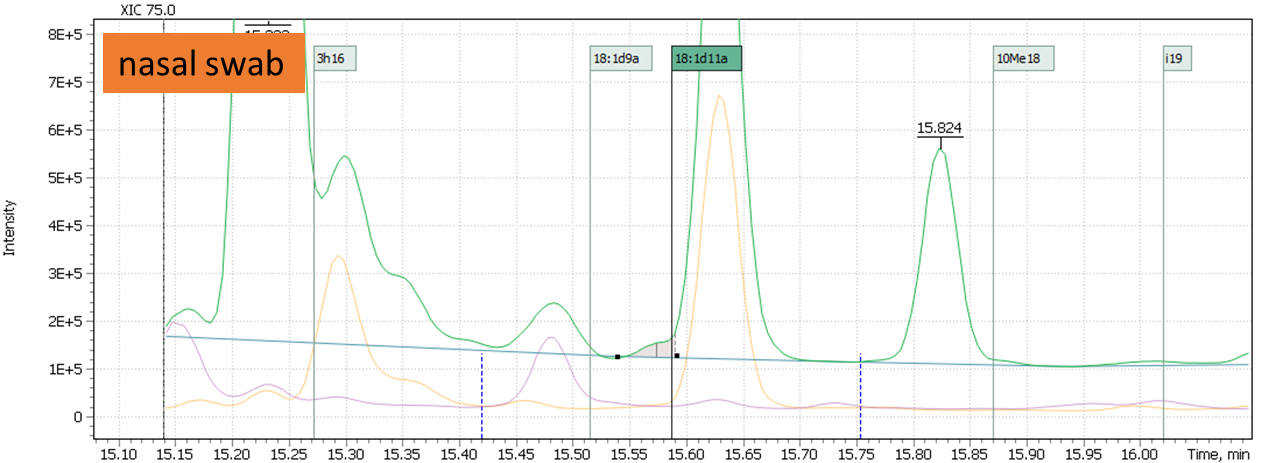
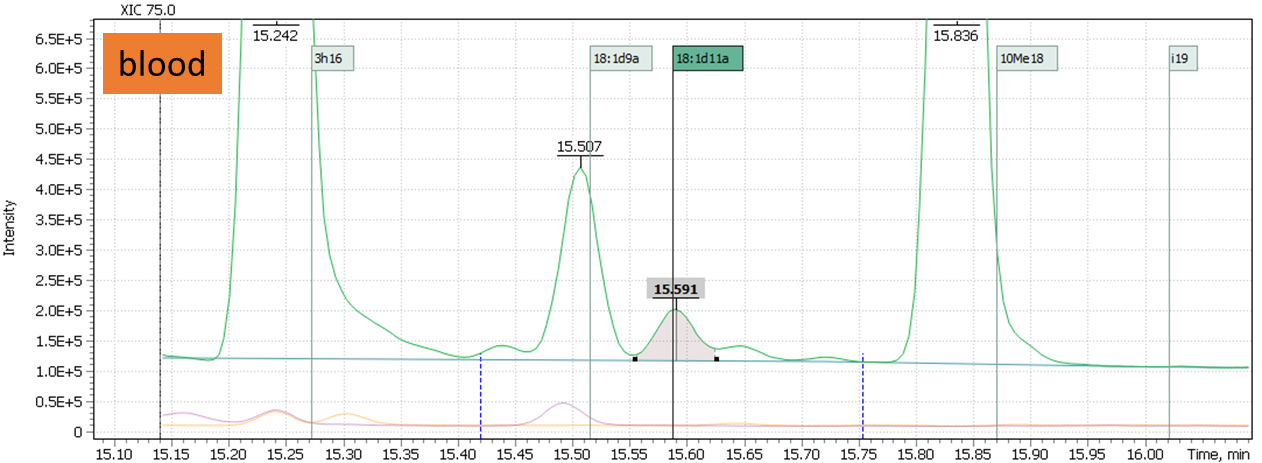
Possible integration patterns for 11,12-Octadecene aldehyde mass peak in various matrices are shown in Figure 1.
Same kind of problem is often encountered while monitoring pesticide residues in various plant extracts by single quadrupole GC-MS. Routine laboratories typically monitor the same list of target pesticides in broad range of samples including vegetables, fruits, cereals, and oilseeds. The different nature of these sample matrices and their complexity implies the formation of a variety of interfering components showing up on the mass chromatogram profile. Result of that, it is unlikely to get as identical pattern of automatic peaks integration in grain samples, as that in vegetables or fruits. This effect grows bigger and more pronounced at trace concentration level of residual pesticides.
Fig. 1. Differences in the environment and complexity of the integration of 11,12-Octadecene aldehyde in biological matrices (blood, feces, nasal swab).
 |
 |
 |
 |
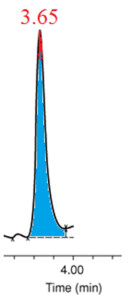
Multicomponent analyses’ other complexity is coming from different nature of target compounds that typically belong to different chemical groups to be analyzed on a single run: alcohols, acids, aldehydes, hydrocarbons, esters. All and each of these compounds have specific chromatographic separation properties, correlated to width of their respective chromatographic peaks. For example, high-boiling compounds will have broadened peaks at the base, as opposed to peaks with an early elution time (Figures 2a and 2b). Obviously, use of automatic integration in this case may likely cause losing part of measured peak area and hence may require manual adjustment of the integration method.
Besides, increasingly high sample workload on a GCMS instrument in high throughput routine laboratories leads to wear-n-tear of chromatography parts of the instrument and consequently further deteriorate separation, thus, adding complexity to chromatographic profile of the sample. Keeping correct peak integration in automatic mode without manual adjustment becomes problematic on long term.
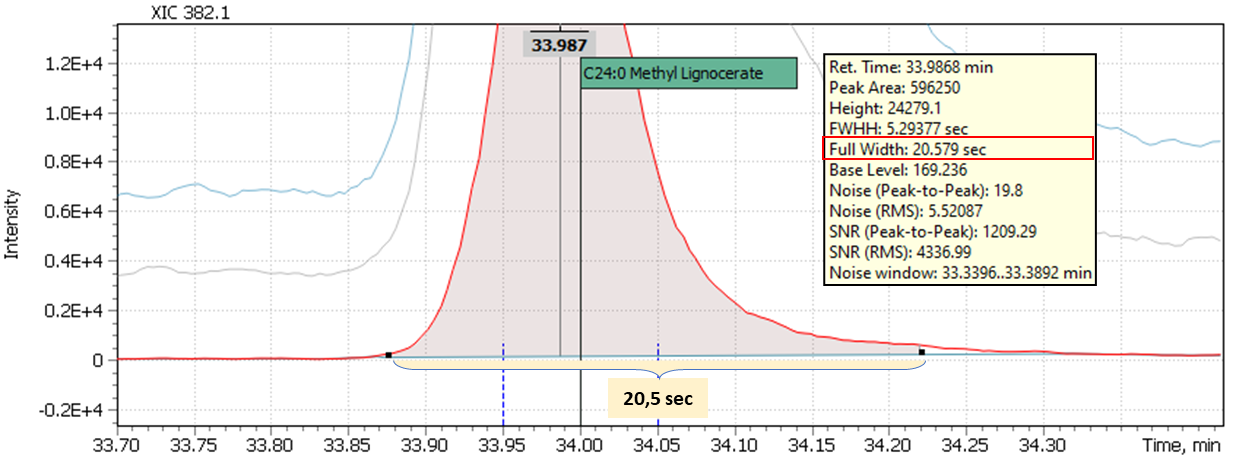
Fig. 2a. Signal of early eluted peak of myristic acid methyl ester (C14: 0)
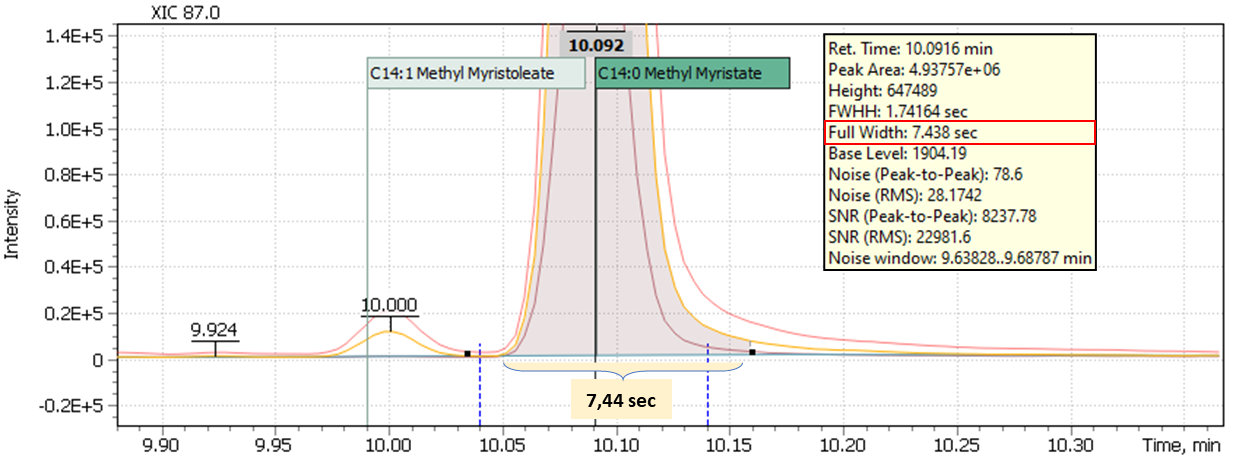
Fig. 2b. Signal of late eluted peak of lignocerinic acid methyl ester (C24: 0)
Notably, multicomponent analyses often involve quantification of both trace level compounds near their respective LOQs of the instrumental method, and those having high-intensity major peaks. It is certainly easier for automatic peak integration algorithms to work with high-intensity signals, where the moment of peak start (rise) can be reliably determined by mathematical data processing algorithms. The signals at trace levels must also be reliably integrated even though there may be fluctuations in the baseline.
All this makes it necessary to have on-going control over the peak integration pattern, uniformity, and consistency in the peak integration of calibration samples, as well as identity of peak integration parameters used over long batch statistical experiments. Such requirements can often serve as a basis for manual edits to automatically integrated peaks. Despite the fact that, according to the literature and recommendation letters of the supervisory authorities, there are no clear and strictly regulated procedures describing how to properly perform such manual integration of peaks [4], it is assumed that the laboratory itself should have a clear policy on how peaks should be integrated in any experiment, especially if it is a routine analysis. Otherwise, there is a possibility of distortion of the chromatographic data [4].
There are two main reasons for data distortion:
- Due to the peak area “cut-offs” (“Peak Shaving”) – a result of manual baseline adjustments leading to reduction of the peak area. If “peak shaving” is done on signals of analytical standards, used for building a calibration curve, then the subsequent correctly calculated test sample will show increased concentration of relevant compound. In the case peak shaving is done for the test sample, the result of a respective compound quantification will show a reduced concentration of that analyte. The “peak shaving” is clearly explained in Figure 3 and corresponds to baseline #2 case.
- Due to the “increase” of peak area (“Peak Enhancing”) resulting from drawing baseline during peak integration as shown in fig.3 (baseline #3). Then, the target component is characterized by an increased peak area and reported at higher concentration. In Figure 3, line 3 corresponds to peak enhancing on the chromatogram.
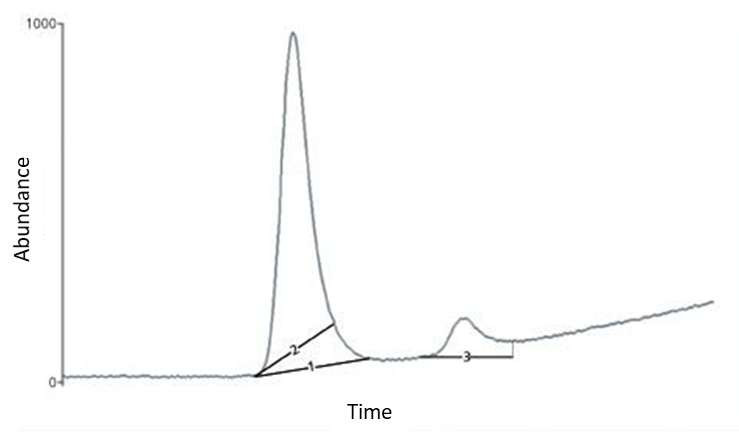
Fig. 3: Examples of “peak shaving ” (baseline 2) and “peak enhancing” (baseline 3). [4]
To reduce risk of sample quantification errors due to inconsistent integration, both automatic and manual, the Q-Tek GC-MS Software (Maestro-Analyst) offers a novel tool called “Handbook” that helps an operator to process chromatographic peaks in a consistent manner. The Handbook is an atlas consisting of annotated chromatograms collected and commented by a user having administrator’s privileges. Each atlas page is linked to a specific compound and, while going from peak to peak through chromatogram following the list of target compounds, as specified in quantitative method, it is displayed in a separate window as a visual help on peak integration.
The “Handbook” feature in Q-Tek GC-MS software
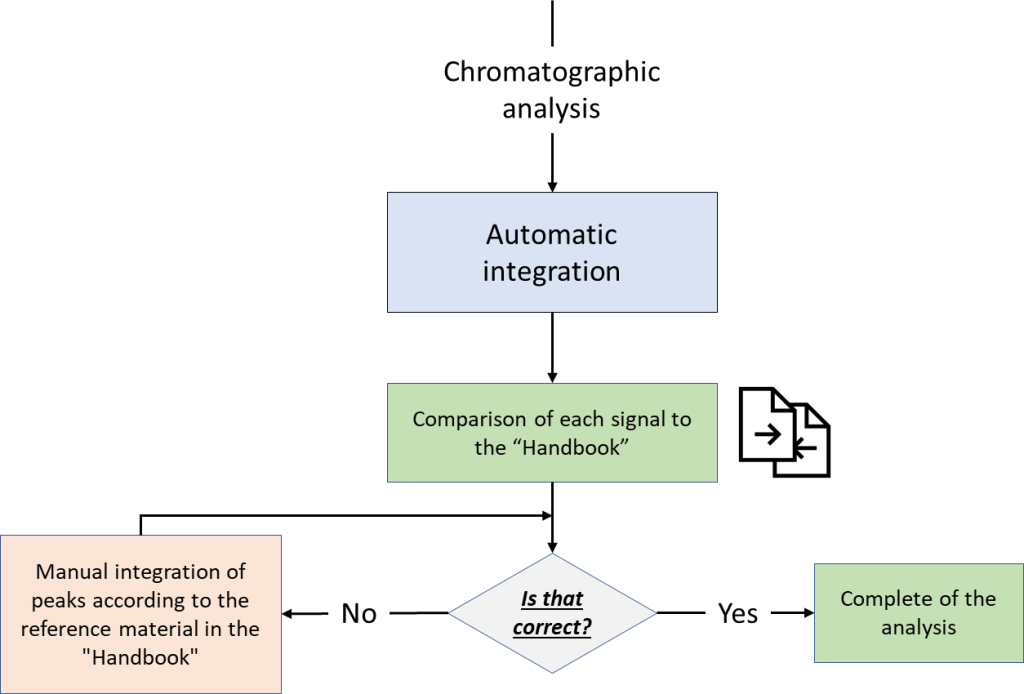
Visual control over peak integration consistency can be an easy task with the novel “Handbook” feature in Q-Tek GC-MS Software. This feature enables a user to instantly retrieve proven examples of target compound peak integration in a given matrix, as graphics along with relevant notes of guidance for analyst. The operating principle of the feature is based on library or atlas of graphical objects linked to a compound CAS number. The proposed flowchart for visual control of integration correctness is shown in Figure 4.
Fig. 4. Flowchart for visual control of integration correctness
The preparation of the reference material for the atlas should be done by proficient users with administrator rights or research managers who understand details of the instrumental method, having experience in chromatographic method development. The proposed options for integrating peaks should comply with science-based approaches and follow standard operating procedure [5].
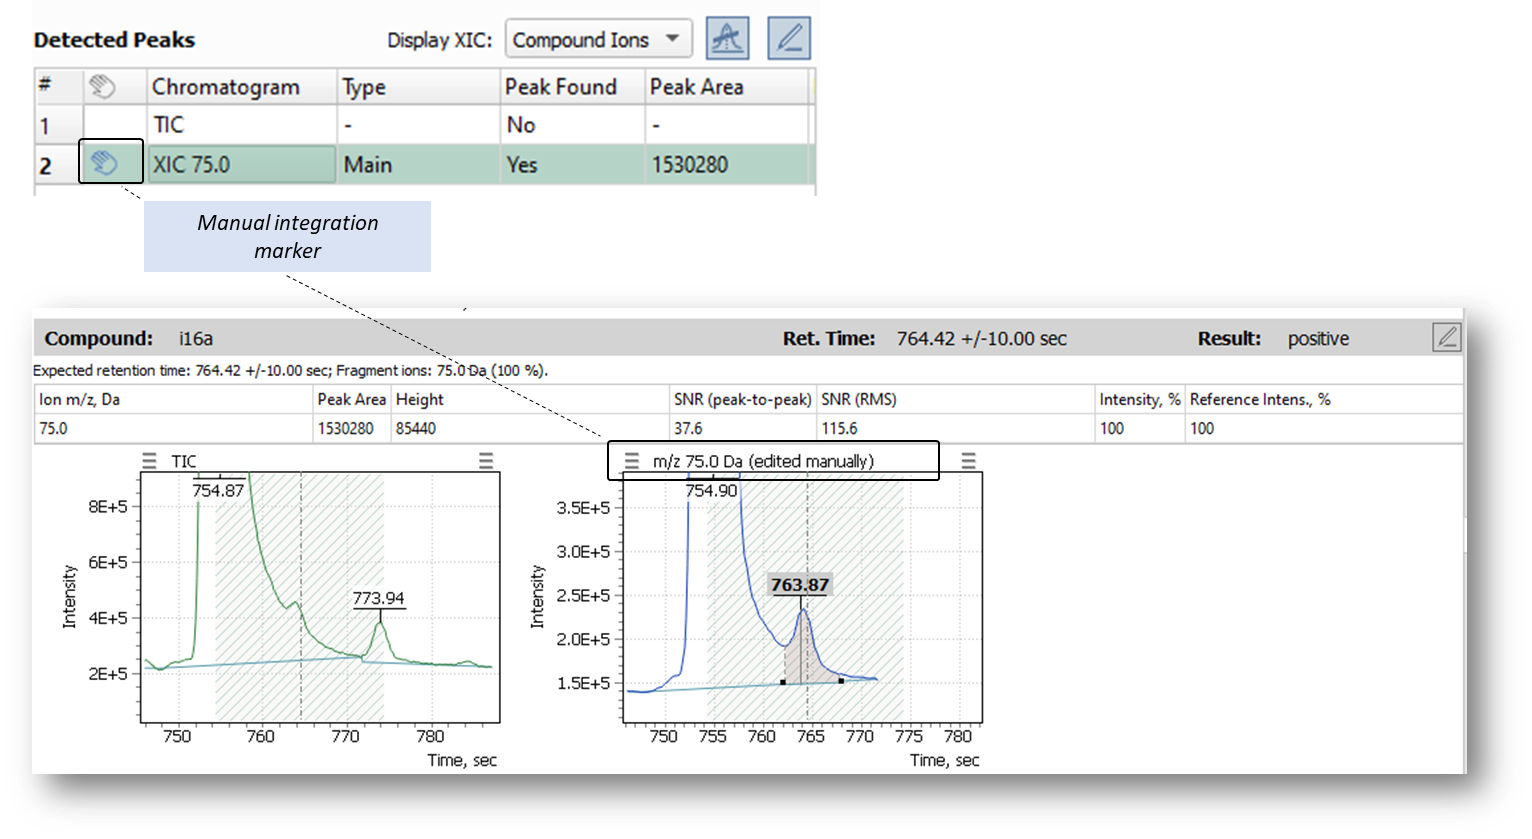
Once atlas of reference materials has been built, any operator with little experience in chromatography can always have at hands examples of correct integration and processing of peaks, to keep risk of possible unintentional data distortion low. At the same time, following common guidelines aimed at ensuring the consistency and reliability of laboratory test results (GLP, GMP), any manual data edits are captured and tracked in Q-Tek GC-MS software, being highlighted with special markers, as shown in Figure 5. As you can see, the markers of manual edits trace and highlight any bit of data from the very moment of manual intervention up to the final report.
Fig. 5. Marking the use of manual integration in data processing and in reporting documents
Configuring the “Handbook” feature
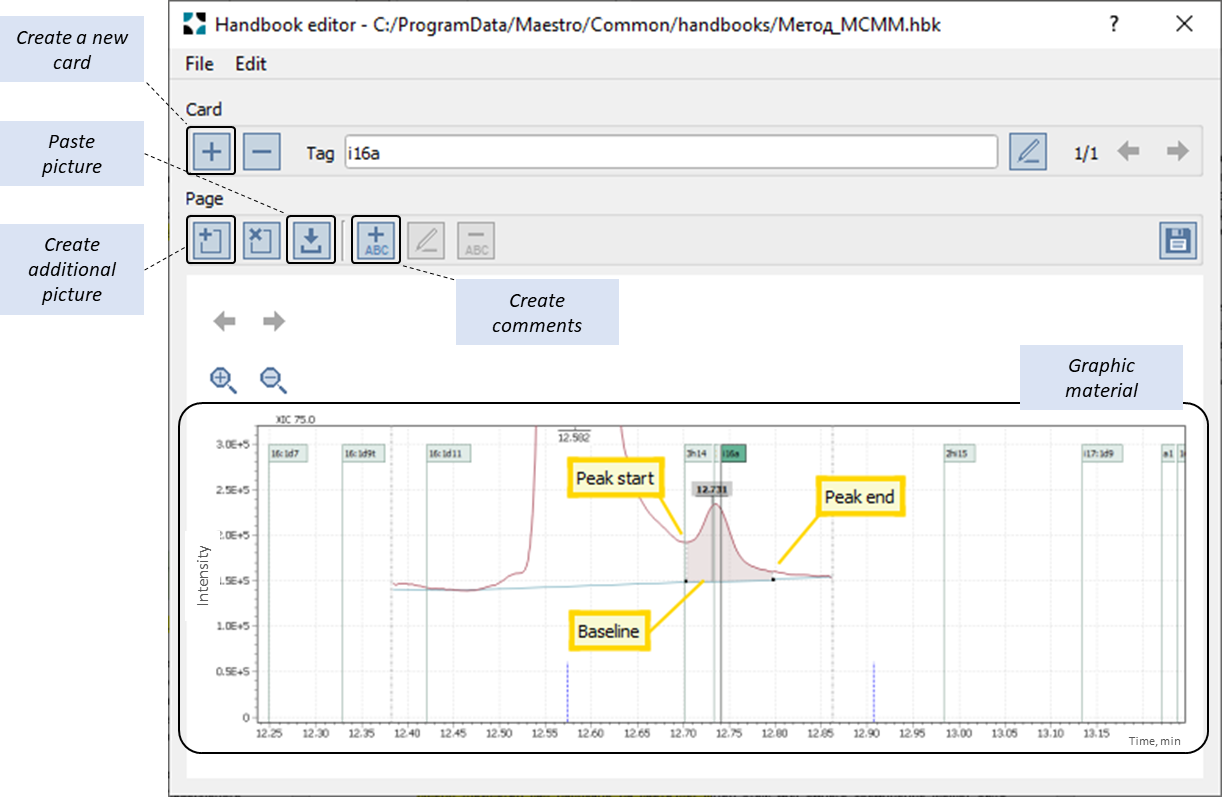
To build appropriate collection of reference material for the atlas, an expert selects suitable examples of data that provide the most informative appearance of the correct peak integration amidst typical interferences. Thus, selected chromatograms are then loaded to PC clipboard and saved to corresponding reference card in “Handbook” atlas.
When the name of a target compound matches the identifier on a Handbook atlas card (Fig. 6) the software pulls the relevant graphic information stored in atlas into a separate pane to display and synchronize the view with the target peak appearance on the test sample chromatogram. In this case, several variants of the reference material cards can be retrieved for a single compound (Fig. 1) should it appear differently in various matrices.
Besides, important guidance text messages to supplement the graphics can be optionally created to help a future user to understand the details of the reference material (Fig.6 «create comments»).
Fig. 6. Example of creating and marking up the “i16a” sample card for the “Method_MCMM” reference»
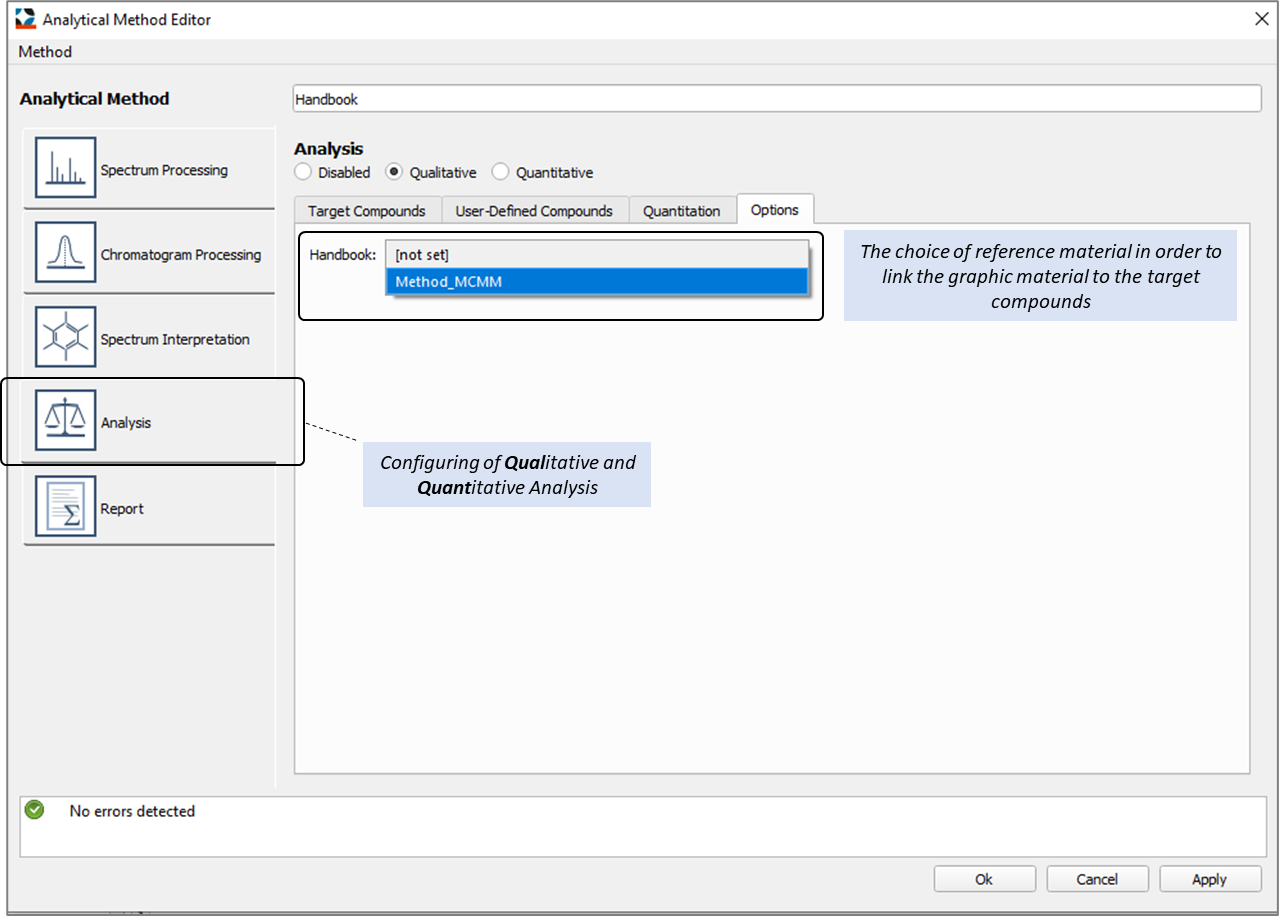
Thus, prepared reference material for the Handbook is saved to memory of Q-Tek GC-MS software under any user-created name and can be used in later work by selecting the appropriate Handbook from drop-down list of available names in the “Reference Book” menu on The Analytical Method editor window (“Analysis” tab) – see fig.7
Fig. 7. The Analytical Method editor window, the “Analysis” tab
Examples of using the reference material
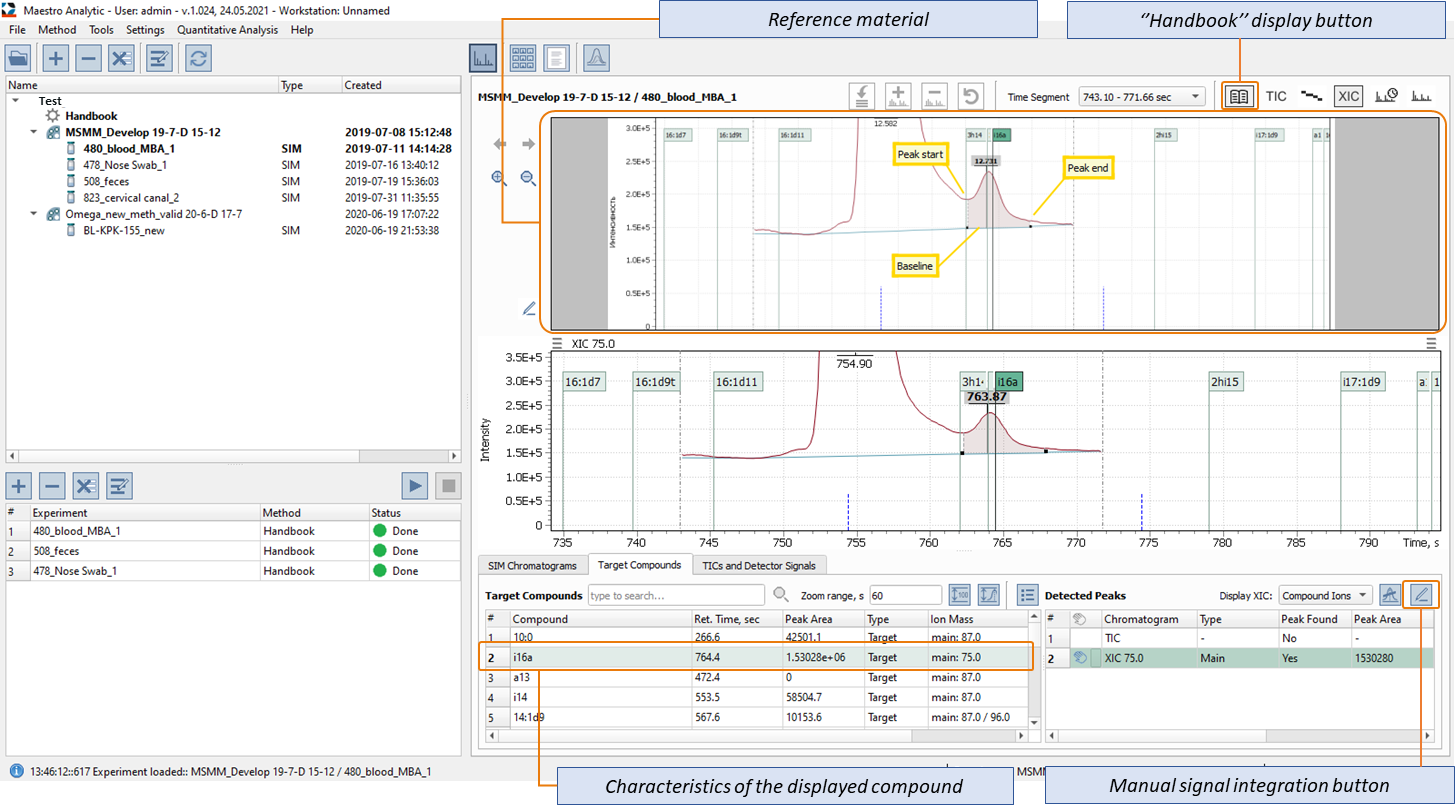
Figures 8 shows an example of displaying the Q-Tek GC-MS software window, where, simultaneously with post-processing and validation of the microbial marker mass spectrometry data, visual control of automatic data integration results is also performed in real-time using the “Handbook” feature. Peak detection in a human blood sample is shown. The ease and convenience of using the Handbook software feature in a single software window real-time are notable.
Conclusion
The Q-Tek GC-MS Software Handbook feature provides an easy real-time control over correct integration of target peaks, having test sample chromatogram synchronously displayed for comparison against the reference information stored in the Handbook atlas. That helps to maintain consistency of peak integration pattern during both automatic and manual integration.
The data processing errors resulting from typical integration mistakes committed by users with little experience in chromatography can be much reduced. Likewise, university students and postgraduates may benefit from the Handbook feature to improve their skills in chromatographic laboratories.
The option to add text comments on top of the reference chromatograms further enhances educational impact of the Handbook by drawing attention of a trainee to the most important details during processing various chromatographic profiles. The toolkit is available in Q-Tek GC-MS software rev. 1.024 or later.
Fig. 8. Example of integrating the peak of iso-hexadecane aldehyde (i16a) in a blood sample with simultaneous visual control of the correctness of peak detection.
Library
- World Health Organization (WHO), Technical Report Series No.996 Annex 5 Guidance on Good Data and Records Management Practices (WHO, Geneva, Switzerland, 2016).
- EU GMP Chapter 6 on Quality Control (2014)
- FDA Current Good Manufacturing Practice for Finished Pharmaceutical Products, 21 CFR 211 (2009).
- D. McDowall, Questions of Quality: Where Can I Draw The Line? LCGC Europe-06-01-2015, Volume 28, Issue 6, Pages: 336–342
- Standard operating procedures. Chromatographic peak integration procedures, SOP 1001, p. 1-33, 01/10/2000, rev. 0.0
- A. Osipov and N. V. Verkhovtseva. Study of human microecology by mass spectrometry of microbial markers. Beneficial Microbes, March 2011; 2(1): 63-78