Introduction
Reliable quantification of pesticide residues in food poses analytical challenge due the diverse chemical structure of the pesticides, decreasing limits of detection coming from newly adopted regulations, wide varieties of natural matrices and overall complexity of the latter. The complexity of the natural matrices leads to so-called matrix effects that impede correct identification and quantification of the target analytes in a sample. It is presence of severe matrix effects, in particular, co-eluting matrix components, that often call for use of selective scanning modes in mass-spectrometry methods. Those matrix components are detected at retention times same as those of the analytes imposing difficulties of analyte’s correct identification and quantitation.
The fig 1 exemplifies matrix effect while analyzing Endosulfan pesticide extract from the wine grape sample. The target ion signal at 240.9Da is much overlapped by interfering signals from matrix components eluting at the same time.
Fig. 1. TIC chromatogram (upper) of wine grapes extract and Extracted Ion Chromatograms (lower) of specific fragment ions from Endosulfan pesticide.
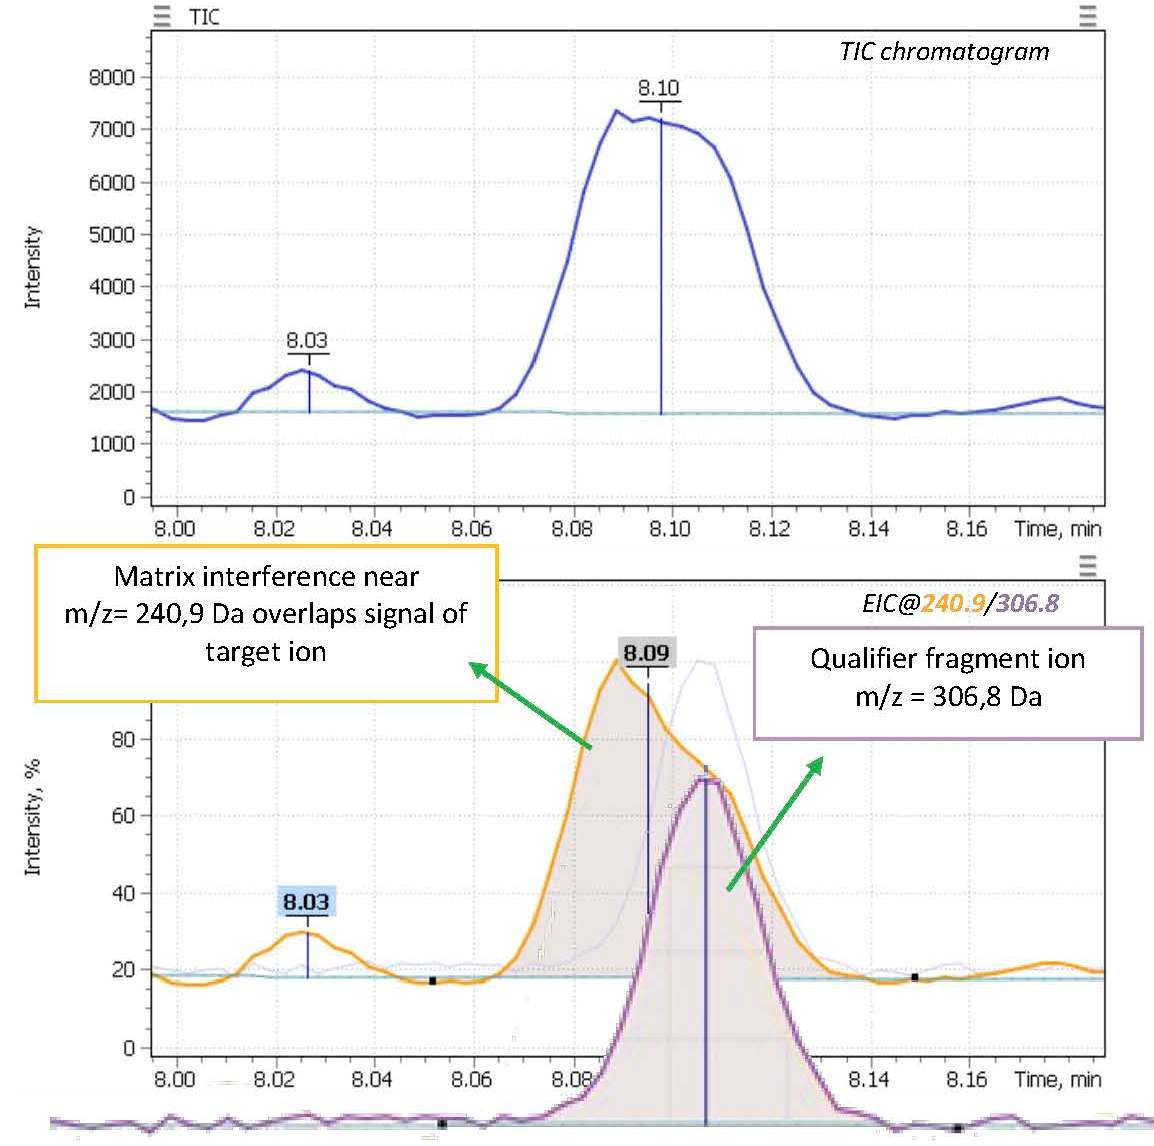
Fig.2 Detection of Pyrimethanil in different matrices – wipe grapes and in cannabis seeds – in comparison.
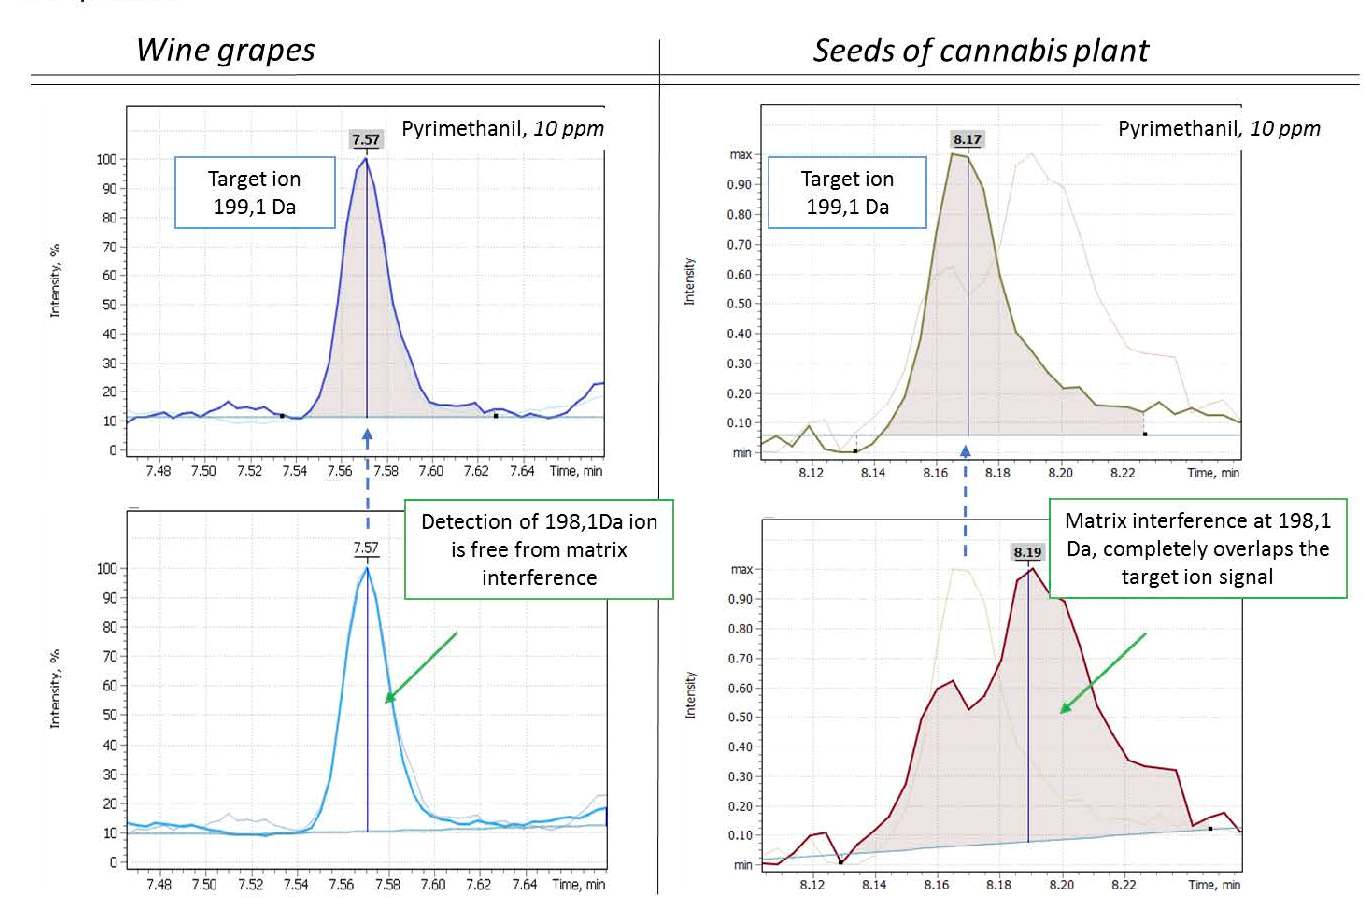
The number of such interfering compounds depends on the matrix complexity. They form up matrix background spectrum that distorts the target analytes’ spectra recorded in both Full Scan and SIM modes. This is why selection of a universal set of target ions to be monitored in different matrices is hardly possible for any given analyte. While working well for some matrices they may become unsuitable for the others producing results of poor quality due to different nature of the new matrix. Fig. 2 provides a good illustration of how Pyrimethanil fragment ion at 198.1Da works well for wine grapes extract while in Cannabis plant seeds extract it suffers from matrix interference. To overcome the matrix challenge an analyst must go through time consuming numerous injections of standards mix and blank sample matrix to adjust one’s analytical method by optimizing both separation conditions and data acquisition parameters.
The purpose of this work is to introduce our novel post—run data processing algorithm “FlexSIM” and demonstrate it could help an operator to minimize effect of matrix interferences present in complex sample extracts during quantitative analyzis on Q-Tek single quadrupole GC-MS. The algorithm involves re-selection of a quantifier ions during post-run processing of the acquired GC-MS data without a need to re-run the samples again or to recalibrate the instrument. It should be noted the algorithm complies with most of existing guidelines on analytical quality control and method validation procedures.
Experimental
Standards and Reagents
All reagents used in this work were HPLC grade. Pesticide standard mixes were commercially obtained from Restek (USA) (Restek, Cat.# 32563; 32564; 32568). 4-Chlorodiphenyl ether (Restek cat# 31620) was used as internal standard.
Samples of wine grapes to simulate blank matrix were obtained from a supermarket and extracted by QuEChERS method [2]. The samples were spiked with a mix of 75 pesticides at various concentration levels to estimate LODs for each compound.
The wine grapes were selected for this work due to the fact that pesticides are widely used during grapes cultivation, whereas food safety regulations and control over the pesticides residue level in grapes is becoming increasingly stringent. The growing number of used pesticides makes it necessary to apply multiple component screening methods in order to simultaneously screen the samples for presence of about 100-200 target compounds. Method LODs of a single quadrupole MS system is known to deteriorate when number of targets increases. So, the correct choice of ions to monitor during data acquisition may become crucial for confident quantification of compounds at their trace concentrations in a sample.
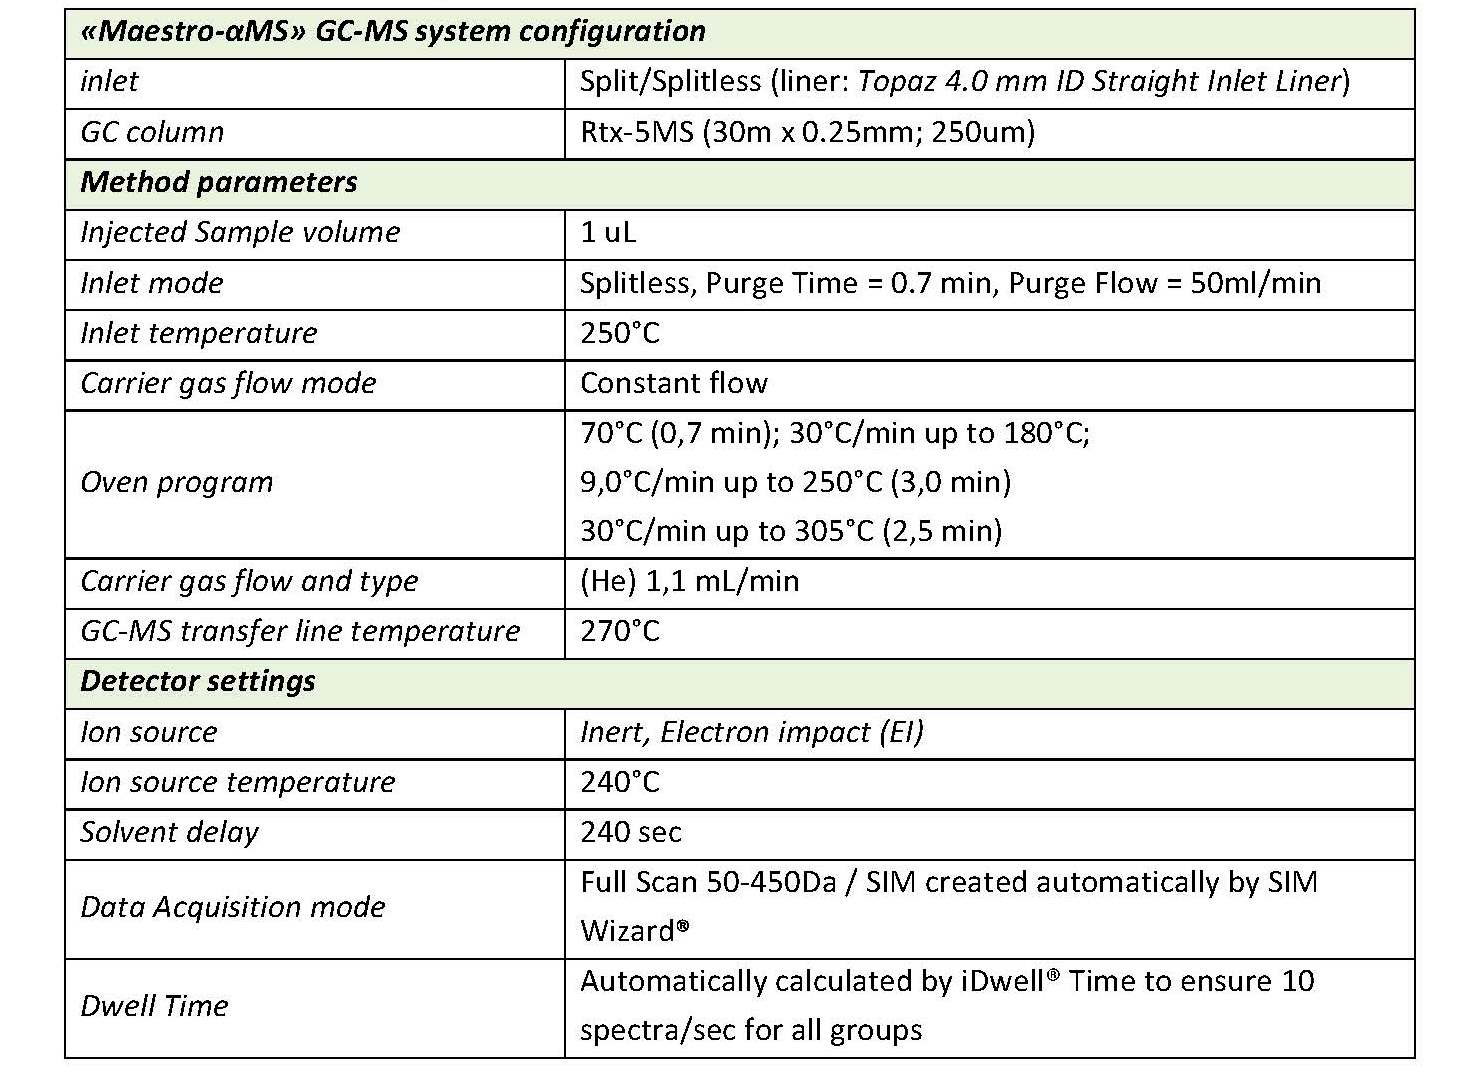
Table. 1. GC-MSD method parameters.
Sample preparation
Samples of wine grapes were homogenized and then extracted by QuEChERS method [2]. The extracted samples were analyzed on Q-Tek single quadrupole GC-MS. The GC-MS method parameters are outlined in Table 1.
Q-Tek proprietary data processing algorithm SIM Wizard ® was used to automatically build SIM method based on full SCAN data from pure standard mix. The SIM-library was, then, used to facilitate choice of most informative and optimal ions to be monitored during SIM acquisition. To maximize the system sensitivity iDwell®Time algorithm was engaged. iDwell®Time algorithm automatically groups the target compounds into time segments so, that dwell time on each of the monitored ion mass is as long as needed (see fig.3) The both proprietary algorithms described above are nice productivity tools that finally helped to quickly optimize the data acquisition parameters and to obtain high intensity signal, ideal peak shape and reach statistics on all target masses including those for the analytes occurring at their trace concentrations in the sample. The list of ions to be monitored for each target analyte during GC-MS analysis is presented in Table 2 below.
Fig.3 TIC chromatogram automatically split into time segments for highly sensitive sample scanning in SIM mode for 75 components and ISTD. The process is fully automated and takes about a minute from TIC chromatogram integration to getting an optimized SIM method.
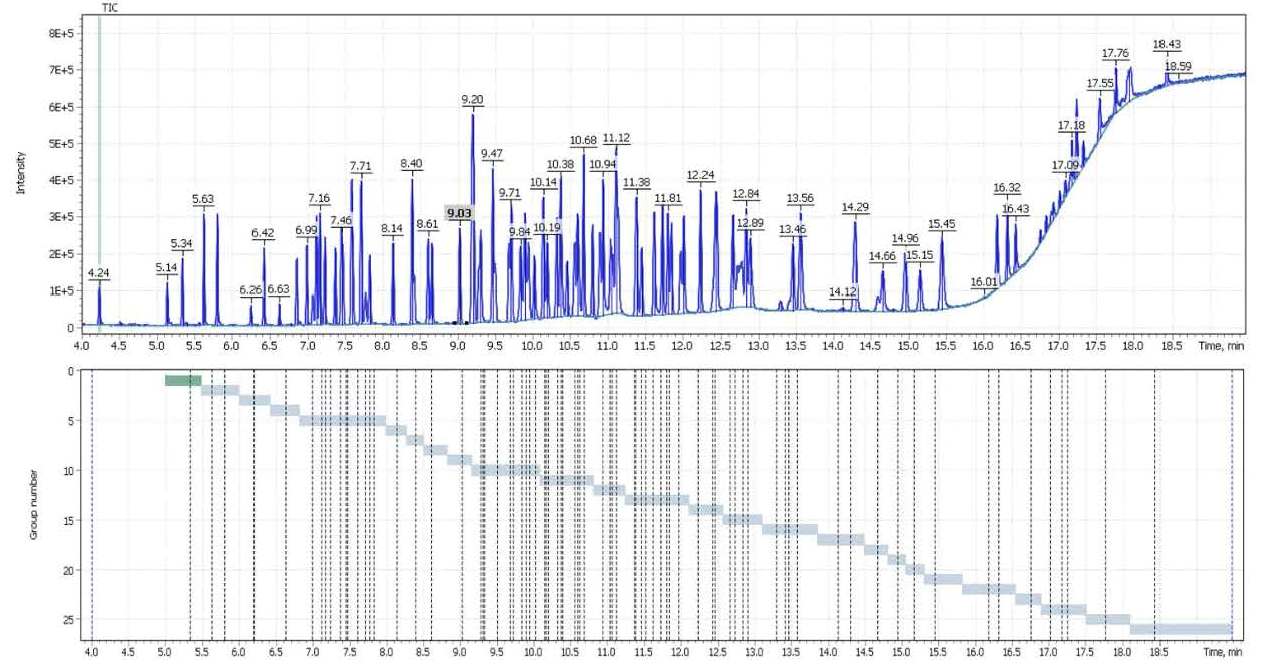
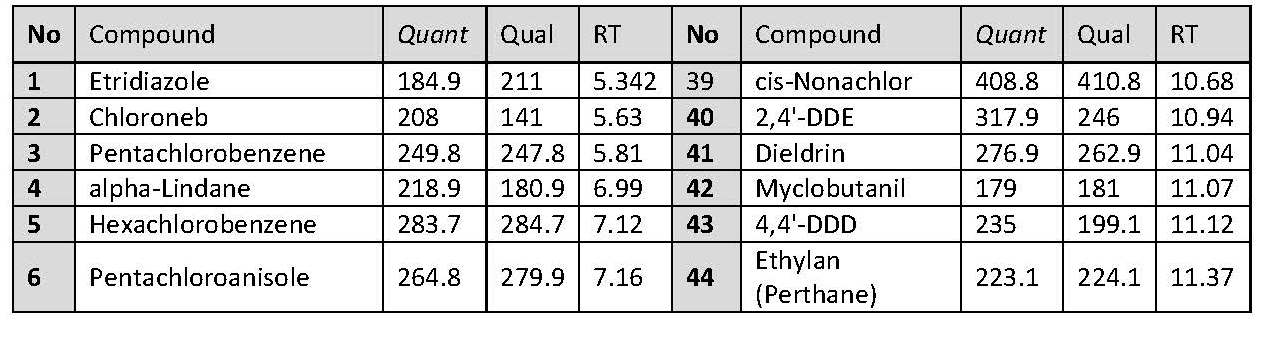
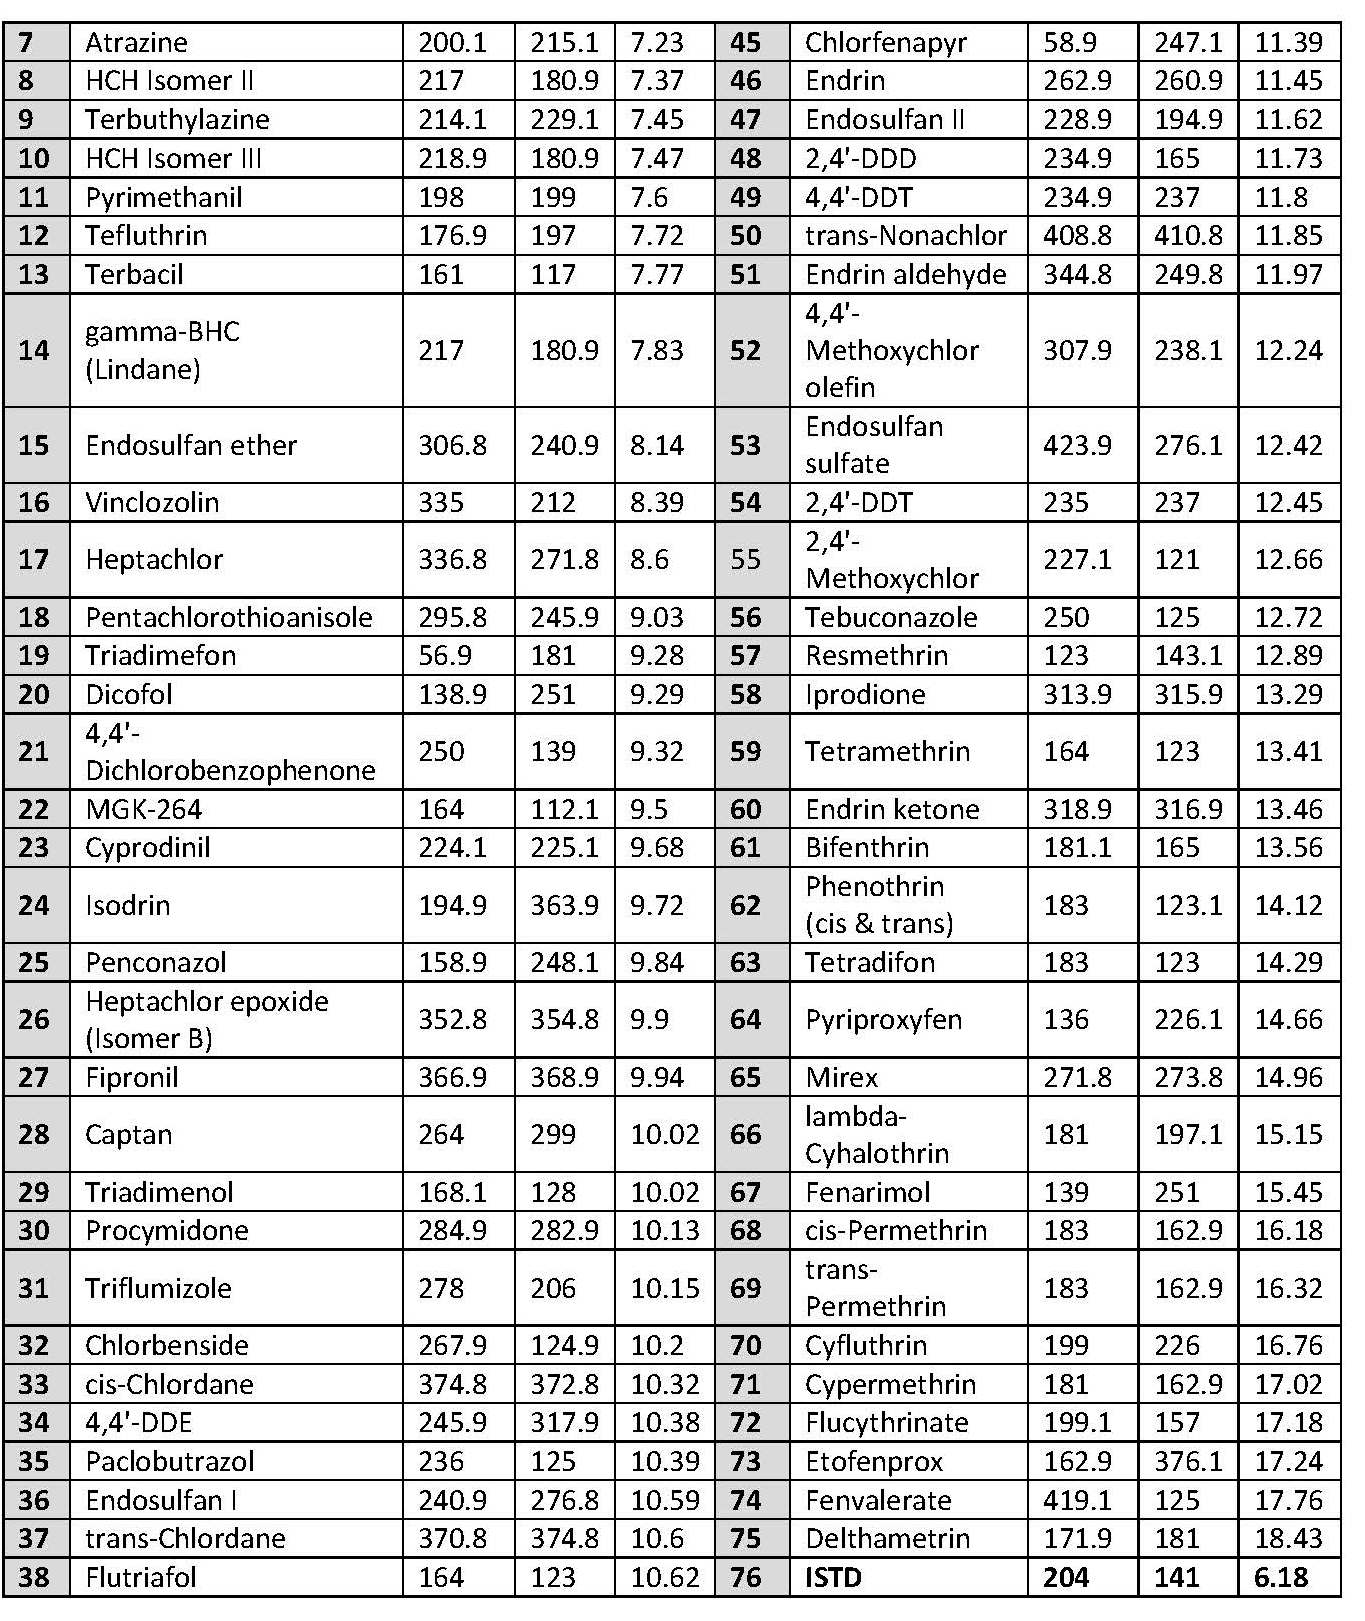
Table. 2. Target analytes’ Retention Times and respective mass-spectrometric detection parameters
Results and discussion
Post-run data processing algorithm «Flexible SIM»
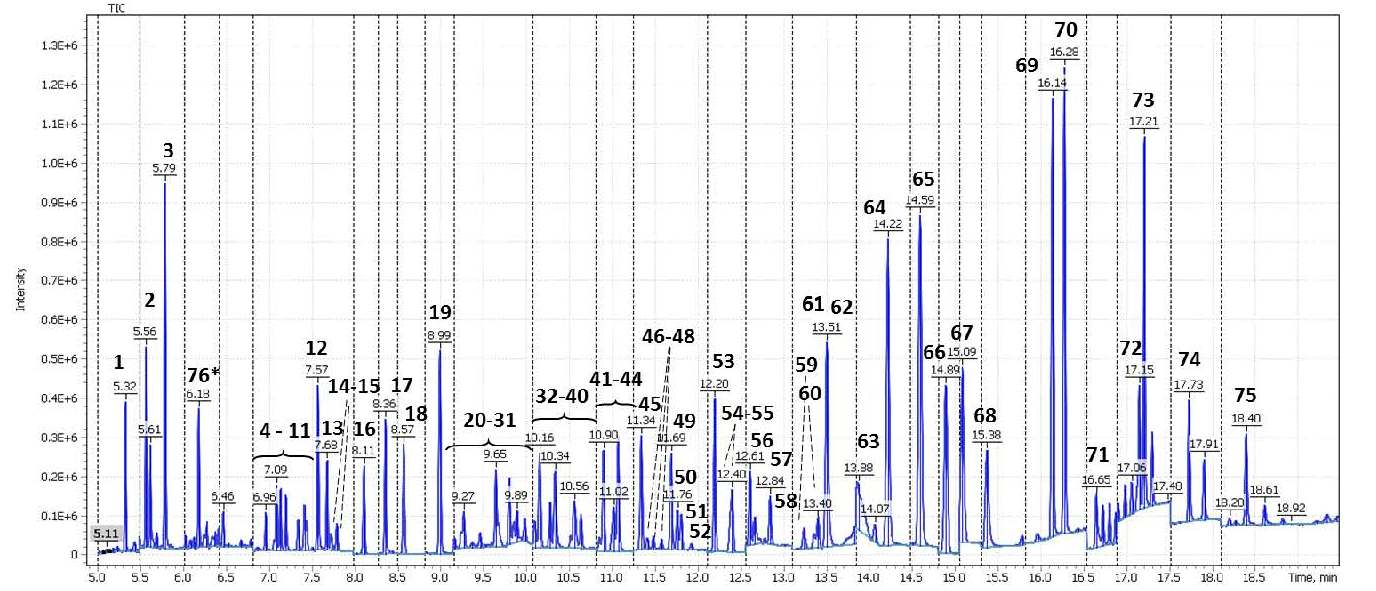
Based on experimental data that had been acquired in SIM mode, the “Flexible SIM” algorithm made it possible for an analyst to select an optimal quantifier ion to be used for quantitative analysis for each target analyte. In particular, the “Flexible SIM” algorithm automatically built calibration curves for all the ions listed in the data acquisition method. So, for each target compound the analyst is given a possibility to toggle between the calibration curves and choose the one that meets quality criteria the best way for a given sample matrix. Figures 4 and 5 show matrix calibration curves for Endrin and Phenothrin suffering from matrix interferences, however, using another ion initially set as a qualifier for calibration while being free from interferences would result in much better calibration quality and more accurate results. Thus, the analyst may want to swap quantifier and qualifier for this specific matrix.
Fig. 4. Matrix calibration for Endrin, influenced by the matrix interferences at ion m/z= 261Da
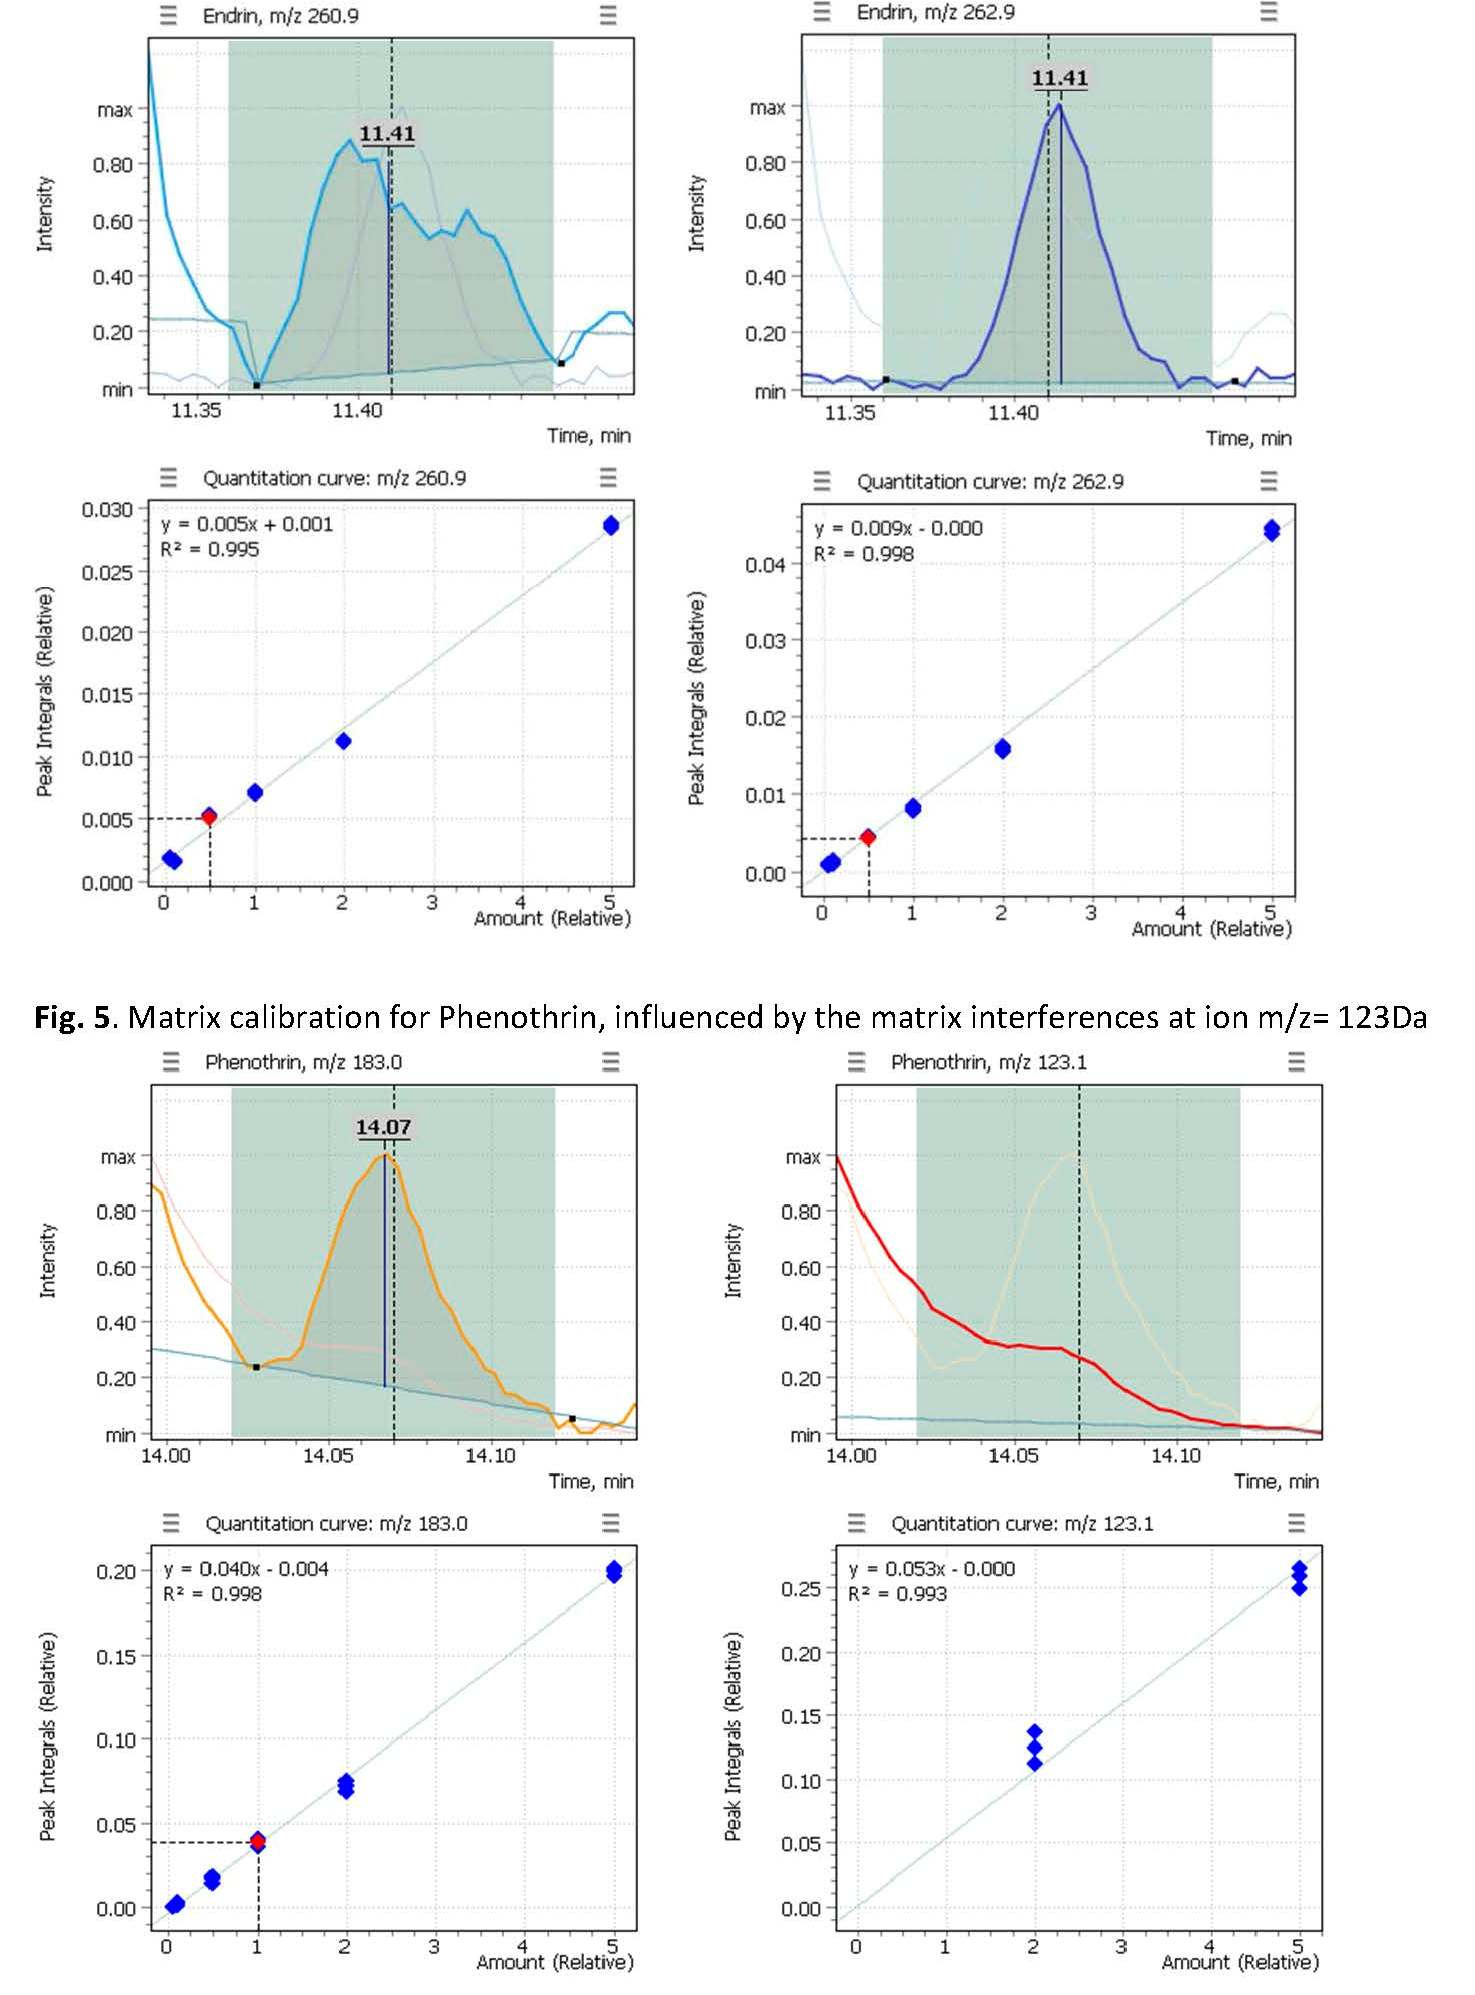
The fig.5 shows matrix calibrations for Phenothrin pesticide. Having ion at 123.1 m/z selected as quantifier initially (left), one can observe heavy matrix interferences resulting in poor calibration
quality, lower regression coefficient and, likely, quantitation errors. However, when an analyst re-assigns earlier qualifier at m/z 183.0 as a new quantifier we shall get significant improvement of the calibration quality and should now be able to quantitate the target analyte more accurately. The formerly used quantifier shall become a new qualifier, then – as they swap together.
This simple swap between quantifier and qualifier ions is in line with SANCO directive [5], as well as with the many other guidelines on analytical quality control and method validation procedures. In particular, according to SANCO directive, where an ion chromatogram shows evidence of significant chromatographic interference, it must not be relied upon to quantify or identify residues. The ion that shows the best signal-to-noise ratio and no evidence of significant chromatographic interference should be used for quantification.
Running method for quantification of pesticide residues in wine grapes optimized by FlexSIM algorithm.
Quantification of the pesticides residues was done with matrix calibration with 4-Chlorodiphenyl ether at 100 ppb used as internal standard.
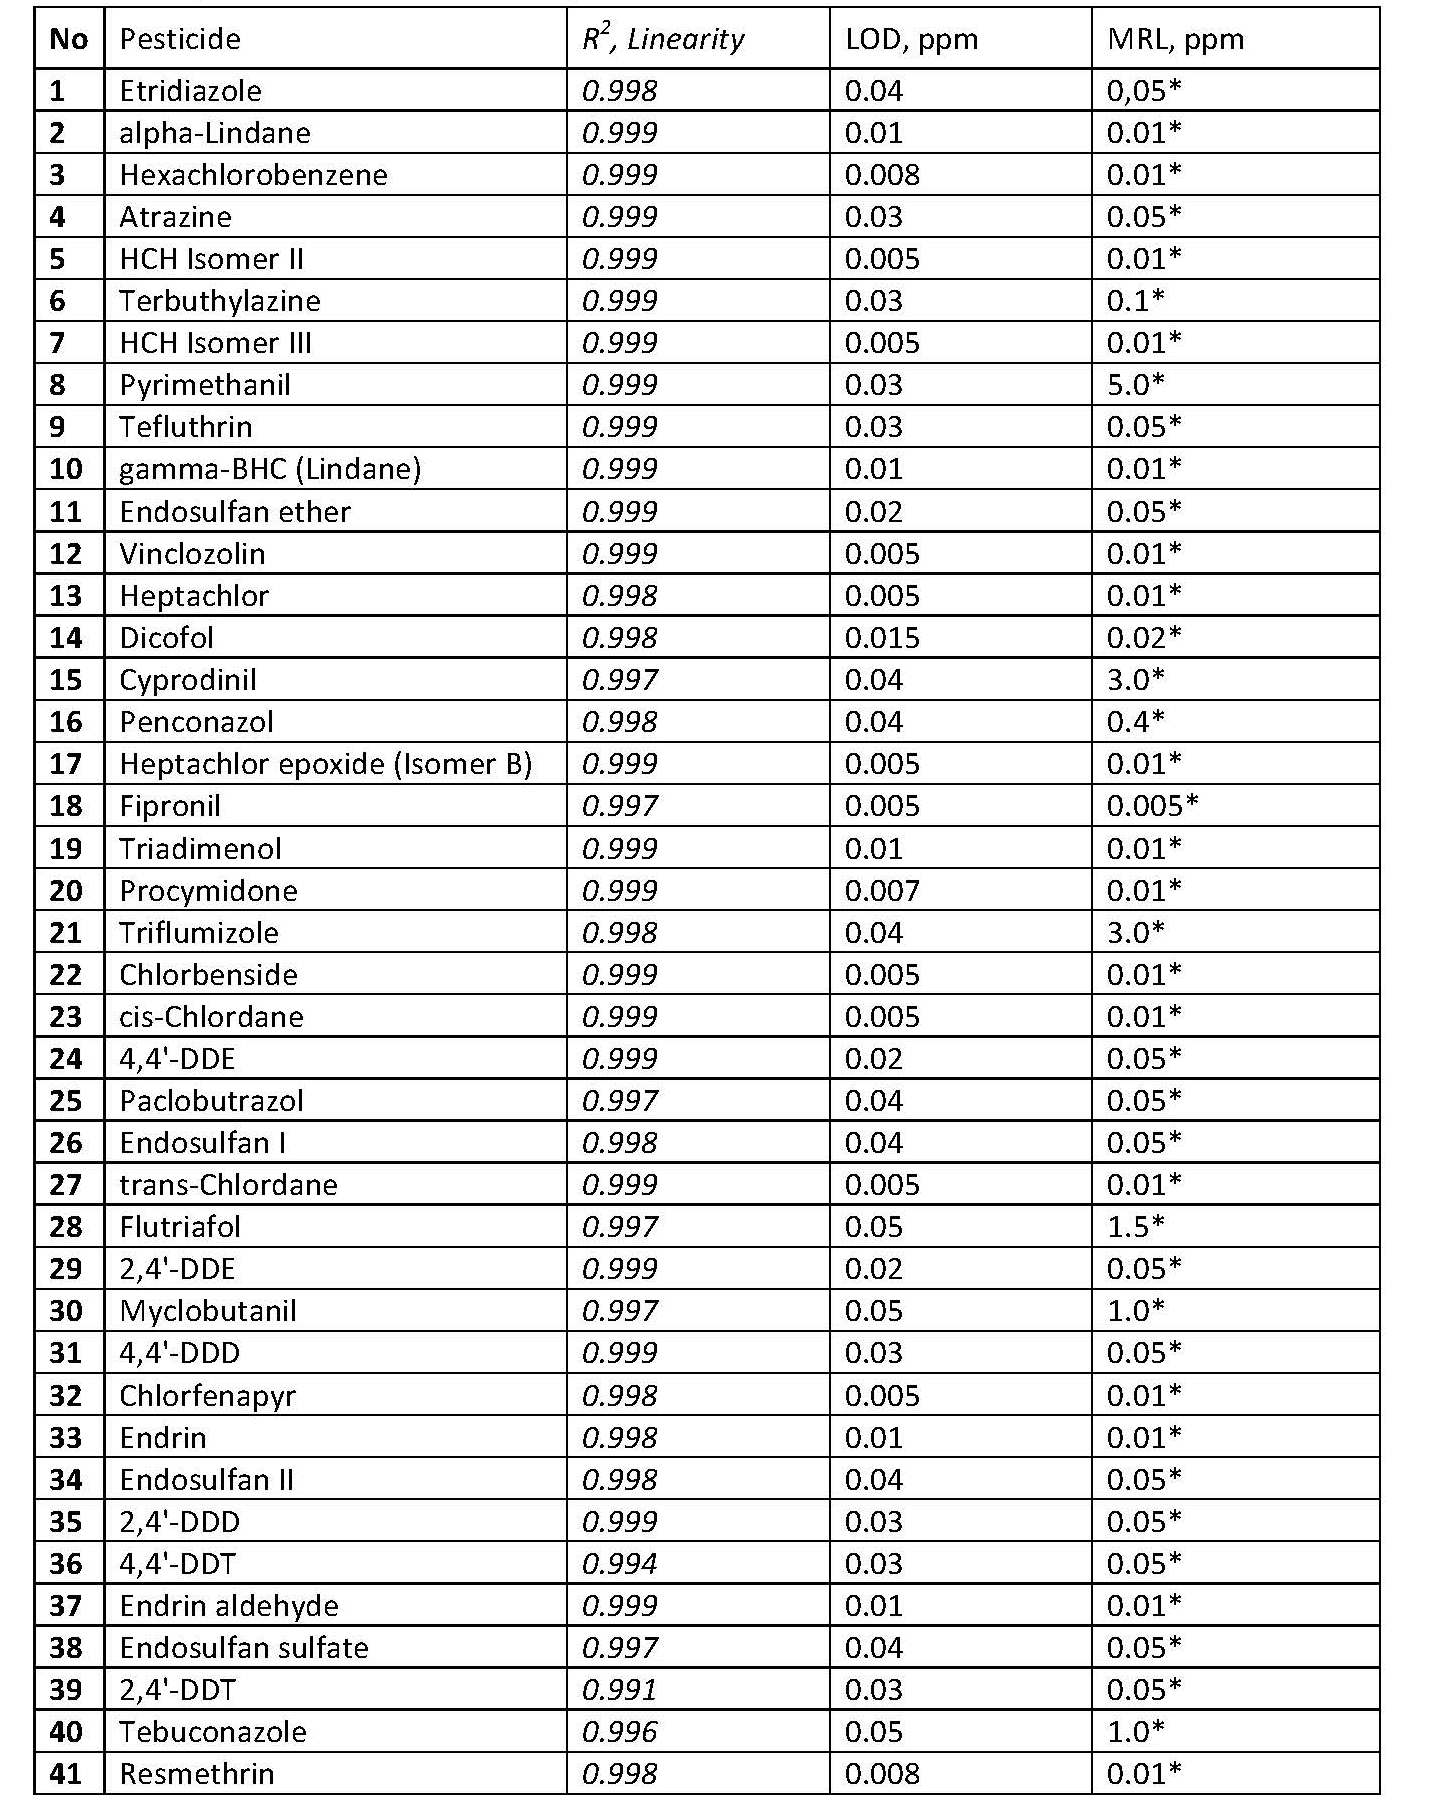
Fig. 6. EIC chromatogram of pesticide mix in wine grapes matrix spiked at 500 ppb
1-Etridiazole; 2-Chloroneb; 3-Benzene, pentachloro-; 4-.alpha.-Lindane; 5-Benzene-hexachloro-; 6-Anisole, 2,3,4,5,6-pentachloro-; 7-Atrazine; 8-HCH isomer II; 9-Terbuthylazine; 10-.delta.-Lindane; 11-Pyrimethanil; 12-Tefluthrin; 13-Terbacil; 14-HCH isomer IV; 15-Endosulfan ether; 16-Vinclozoline; 17-Heptachlor; 18-Pentachlorothioanisole; 19-Triadimefon; 20-Dicofol; 21-4,4′-Dichlorobenzophenone; 22-MGK 264 isomer I; 23-Cyprodinil; 24-Isodrin; 25-Penconazole; 26-Heptachlor epoxide; 27-Fipronil; 28-Triadimenol; 29-Captan; 30-Procymidone; 31-Triflumizole; 32-Chlorbenside; 33-cis-Chlordane; 34-o,p’-DDE; 35-Paclobutrazol; 36-Endosulfan; 37-trans-Chlordane; 38-Flutriafol; 39-cis-Nonachlor; 40-p,p’-DDE; 41-Dieldrin; 42-Myclobutanil; 43-o,p’-DDD; 44-Perthane; 45-Chlorfenapyr; 46-Endrin; 47-.beta.-Endosulfan; 48-p,p’-DDD; 49-o,p’-DDT; 50-trans-Nonachlor; 51-Endrin aldehyde; 52-4,4′-Methoxychlor olefin; 53-Endosulfan sulfate; 54-p,p’-DDT; 55-o,p’-Methoxychlor; 56-Tebuconazole; 57-cis-Resmethrin; 58-Iprodione; 59-Tetramethrin; 60-Endrin ketone; 61-Bifenthrin; 62-Phenothrin; 63-Tetradiphon; 64-Pyriproxyfen; 65-Mirex; 66-.lambda.-Cyhalothrin; 67-Fenarimol; 68-cis-Permethrin; 69-trans-Permethrin; 70-Cyfluthrin; 71-Cypermethrin; 72-Flucythrinate; 73-Etofenprox; 74-Fenvalerate; 75-Deltamethrin; 76-ISTD_PCB#1
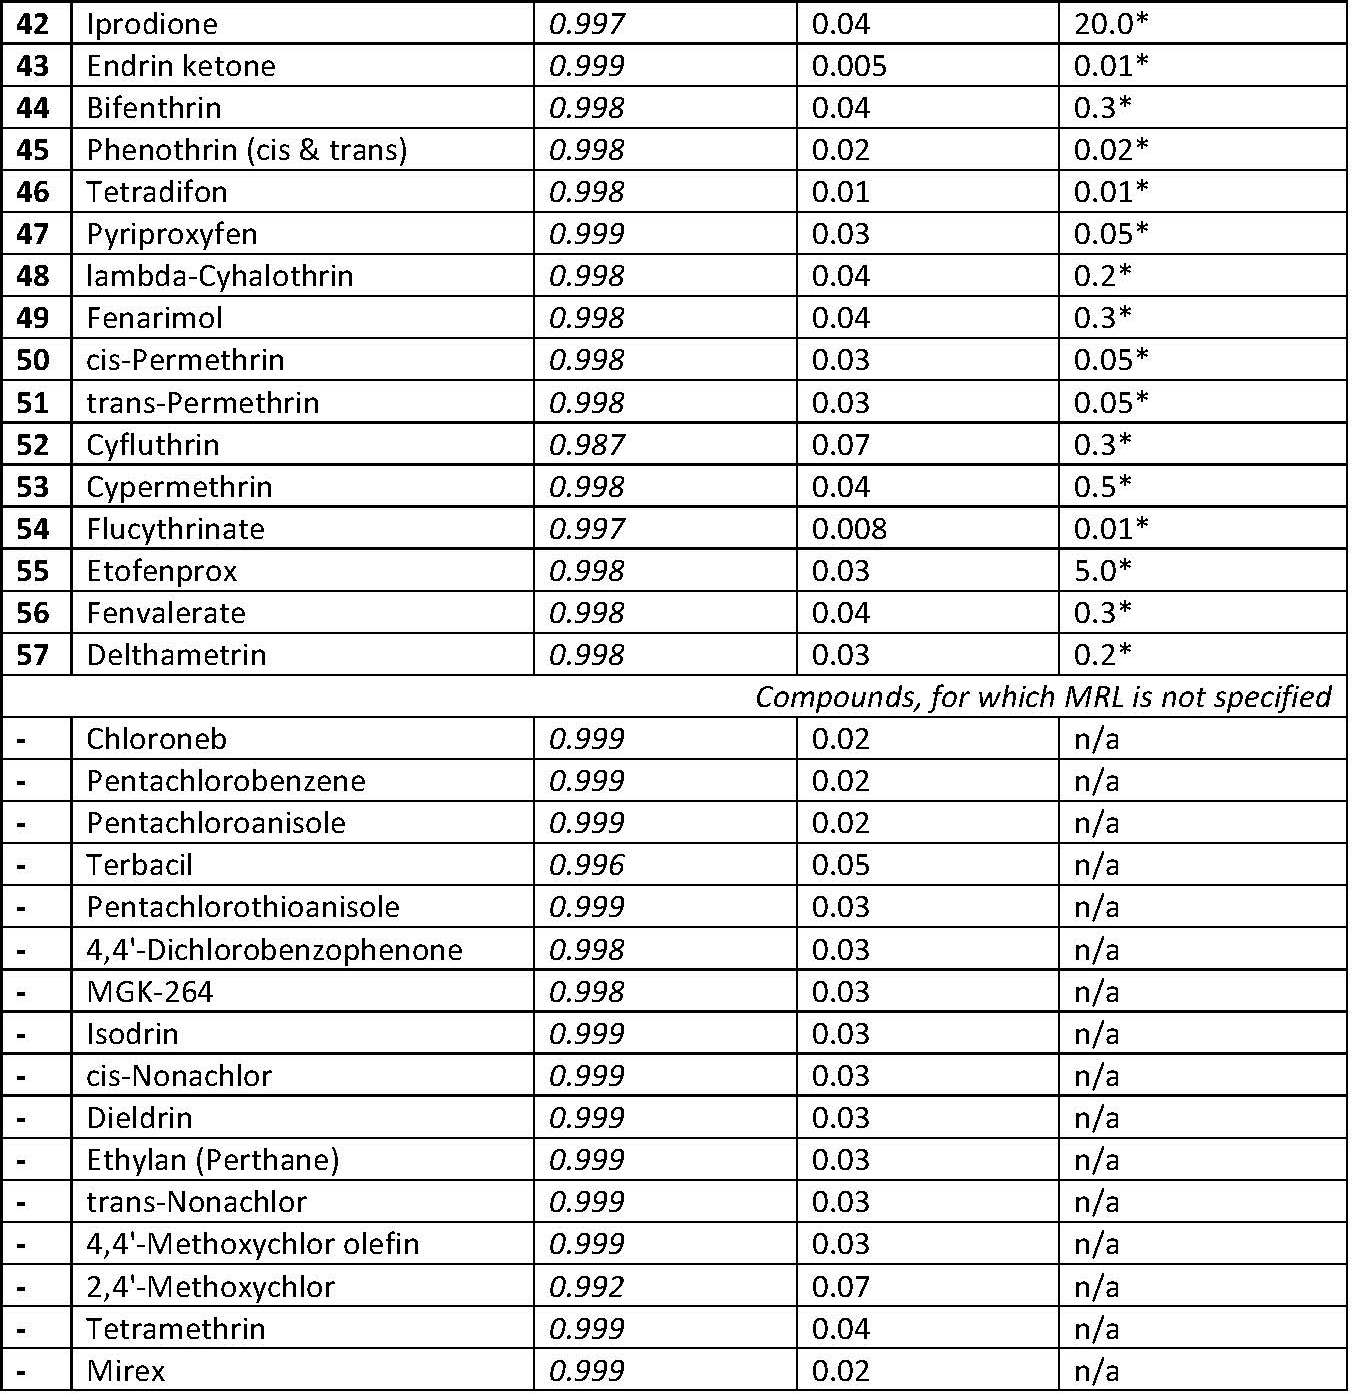
The LOD and MRL have been calculated via Calibration Approach based on three repeats of spiked wine grape QuEChERS extract at each calibration point, as per European ACAC directive [7] (Guidance Document on the Estimation of LOD and LOQ for Measurements in the Field of Contaminants in Feed and Food, 2016). Notably, for 69 of 75 compounds the linearity of calibration was excellent (R2 ≥ 0.997) (Table 3) except Terbacil, Triadimefon, 4,4′-DDT, 2,4′-DDT, 2,4′-
Methoxychlor and Tebuconazole which had 0,990 > R2 > 0,997. The calculated LODs are acceptable as per EU norms.
Table. 3. Experimental LOD and linearity values.
Conclusion
The experimental data have proven the Q-Tek single quadrupole GC-MS to be well suited for reliable quantification of pesticide residues in food, in particular, wine grapes that are used for wine production.
Novel data processing algorithm Flexible SIM helps to reduce time spent by a GC-MS user on optimizing data acquisition parameters of one’s SIM method to a specific matrix as well as to avoid re-running the samples to improve calibration quality.
The GC-MS delivers reliable results for both qualitative and quantitative analyses and features nice productivity tools to help an operator to set up the system and the acquisition method for desired results much faster.
References
1. Nadja Bauer, Eberhard Schüle, Anne Wolheim, Marc Wieland, Ellen Scherbaum. Organic Wine Production – Cross Contamination with Pesticide Residues Caused by Filtration // CVUA Stutgart
2. Anastassiades M., Lehotay S.J, Stajnbaher D, and F.J. Schenck //The Journal of AOAC International V. 86. P. 412–431(2003).
3. WADA Technical Document – TD2010IDCR 4. http://www.fda.gov/
5. EC SANCO/12571/2013 “Guidance document on analytical quality control and method validation procedures for pesticides residues analysis in food and feed”, Implemented by 01/01/2016 6. http://ec.europa.eu/health/index_en.htm
7. Guidance Document on the Estimation of LOD and LOQ for Measurements in the Field of Contaminants in Feed and Food, 2016