
Introduction
Essential oils are products of natural, mainly vegetable origin, which are complex multicomponent mixtures of volatile aromatic compounds. They belong to various classes of organic compounds, mainly terpenoids, less often aromatic or aliphatic compounds [7-9]. Most often, these substances perform “ecological” functions, that is, they protect the plant from various pests and pathogens, participate in plant reproduction, giving color and smell to flowers and fruits, ensure interaction of plants with each other and with other organisms in the ecosystem.
Each plant produces in its secondary metabolism cycle the essential oils that it needs for survival and reproduction. Therefore, essential oils properties of different plants differ significantly. As an example, polyprenols, sterols, labdan alcohols, sesquiterpene compounds and other essential oil components are extracted from the conifer needles. Specific properties of such substances allow essential oils to be used in medicine, in agriculture, as well as in the perfume and cosmetics industry [1].
Use of essential oils in medical practice has a long history. Large part of the known medicinal plants is used primarily as an essential oil raw material [1-3]. However, introduction of new pharmaceutical substances of plant origin into official medical practice is strictly regulated and validated by a prior set of studies on selection of quality criteria and norms to characterize these products.
Aromatherapy is a popular application of essential oils thanks to their unique aroma. Aromatherapy plays a recognized role in human health improvement, and smells of the essential oils contribute to regulatory and adaptogenic ability at subcellular, organ, tissue, systemic and organismal levels, acting on metabolic processes of the body. Obviously, the quality of essential oils is very important for such an application. But, unfortunately, essential oils are easy to counterfeit. While some adulterated oils may still meet broad requirements of perfume industry, the use oils for health improvement is not possible unless ensured that it is an authentic natural product that is being used. Even the oil, labelled pure, may have a low quality and deteriorated therapeutic value [3].
Hydrolate (floral water, hydrosol, essential water, secondary distillate) is another aromatherapy remedy for body care, which has a number of benefits. To obtain the hydrolate, method of steam distillation from various parts of essential oil plants is used. Due to repeated passage of water through the plant material, future fragrant water is enriched with both water-soluble plant extracts, and essential oils as well as many other healthy valuable components.
By their properties, hydrolates are not very different from essential oils, so many experts suggest that fragrant water is considered a weak aqueous solution of essential oils – an alternative to concentrated oil mixtures. Some manufacturers derive an action point from this opinion: they simply dilute essential oils with prepared purified water and sell the resulting mixture as a hydrolate. While the resulting product is marketed as having all the properties of an essential oil, in fact it lacks valuable components, thus reducing its value and efficacy. There are hydrolates that are prepared from synthetic components, the use of such products is usually limited to imitating more expensive flavors. Such hydrolates are classified as “identical to natural” and are not recommended for cosmetics and personal hygiene. Anyway, the most common hydrolates counterfeiting is their production from low-quality and unnatural raw materials.
To confirm authenticity and identify changes that occur during falsification of essential oils and hydrolates, various analytical techniques are used that can take into account technological, agrobiological factors, weather and geographical growth conditions of plants, duration and storage conditions [10-14]. The internationally recognized standards regulating the high quality of essential oils are [15]:
- standards of the International Standards Organization, which has a Technical Committee TC-54 for the standardization of essential oils [16];
- EQA standards of the American Essential Oils Association [17];
- The recommendations on restriction and prohibition of use of certain essential oils of the International Association of Scented substances IFRA( International Fragrance Association), which controls the use of scented substances and essential oils in perfumery and cosmetics [18];
- recommendations of RIFM (Research Institute Fragrances Materials, USA) – an American institute that performs biomedical tests of scented substances and essential oils [119];
- Russian Pharmacopoeia and British Pharmacopoeia [20].
While organoleptic and chemical indicators controlled in the standards are aimed to assess general quality of essential oils in production, or to permit their use in perfumery, they do not provide complete identification of the oil components, do not assess the influence of individual components on the oil properties and do not guarantee authenticity.
Gas chromatography (GC), is often a method of choice for analyzing complex mixtures of terpene compounds (mono-, sesqui-, diterpenes) thanks to the boiling point of most terpenoids being from 150 to 350°C. The use of chromato-mass spectrometric system further expands study of complex multicomponent mixtures of essential oils. For example, GC/MS was used to establish the falsification of sandalwood oil [22] , the marker component of which is santalol, by adding synthetic material Sandalore Verdox, Santaliff, Vertofix Coeur, or Ebanol [23]. By means of GC/MS component composition of lavender essential oil (Lavandula angustifolia L.), which included 170 compounds was characterized [24], furthemore 15 of those were used to build a discriminatory model for detecting adulteration of lavender oil with cheap lavandine (an artificial hybrid of lavender – Lavandula Intermedia).
Thus, falsification detection and authenticity confirmation of essential oils is an important task, both from a regulatory and economical points of view. This work is aimed to verify approach to identification and quantitative assessment of terpene compounds in natural essential oil of common pine (Pínus sylvéstris), as well as to discriminate between similar hydrolate samples by their minor components by Q-Tek GC-MS operated under proprietary Maestro-Analyst software (Q-Tek, Montenegro) along with AMDIS software (NIST, USA), R and Python software environments.
Experimental part
Materials and methods
The objects of the study were a sample of pine essential oil (Pinus sylvestris) purchased at a local pharmacy, as well as two hydrolate samples taken at production during optimization of technology. All reagents used in the study were classified as particularly pure, or HPLC grade. A calibration mixture of n-alkanes (C10 – C40) (Supelco, USA) was used for Retention Indices calculation, purity of each individual substance was at least 99%.
To analyze composition of pine essential oil, 10 µl of the test sample was mixed with 1990 µl of hexane in a chromatographic vial. The vial was tightly closed, then the mixture was shaken on a vortex shaker for 10-15 seconds, then mixed further on an orbital shaker at 220 rpm for 20 minutes. Upon completion of shaking, the mixture was centrifuged at 3500 rpm for 5 minutes. 1.0 ml of the supernatant was injected into the Q-Tek chromatography-mass spectrometric system using an automatic sampler. The parameters of GC-MS data acquisition method are shown in Table 1.
Table 1. Parameters of chromatographic separation method
| Parameters | Settings |
| GC column | HP-INNOWAX (30m, 0.32 mm I.D.; 0,5 µm) |
| Inlet | Split/Splitless |
| Volume of injected sample | 1 µL |
| Inlet program | Splitless for 1.2 minutes, then 50 mL/min |
| Inlet temperature | 210°C |
| Oven program | 40°C/min – 3,45 min;
2.2°C/min upto 90°C – 5,2 min; 2.2°C/min upto 115°C – 13,5 min; 1.5°C/min upto 140°C – 10,75 min; 2.2°C/min upto 210°C – 6,8 min |
| Carrier gas | (Helium) 1.3 mL/min |
| GCMS transferline temperature | 210°C |
| Ion source temperature | 230°C |
| MSD data acquisition mode | SCAN, 50 – 300 Da |
| Solvent delay | 5.0 min |
As described earlier, hydrolate is a diluted aqueous solution of essential oils (about 0.01%), therefore, to achieve an optimal signal in Full Scan mode, 8 ml of hydrolate sample was used for analysis, having its organic components extracted with 1 ml of hexane. The mixture was shaken for 30 seconds on vortex, then mixed on an orbital shaker at 220 rpm for 20 minutes. Upon completion of shaking, the mixture was centrifuged at 3500 rpm for 5 minutes. 300 µl of the supernatant (hexane layer) was transferred to a vial insert. Finally, 1 µl of supernatant was injected into Q-Tek chromatography-mass spectrometric system.
High-polar capillary column HP-Innowax (Agilent, USA), 30m x 0.32mm(id) x 0.5µm, stationary phase 5%-diphenyl-95% – dimethylsiloxane was used for chromatographic separation in this study.
The Total Ion Chormatogram (TIC) signal of the mass detector operated in Full Scan mode in 50-300 Daltons mass range was recorded. The sample components identification was done by mass spectra library search against NIST20 (NIST, USA). Additional degree of confidence for compound identification was provided by use of linear Kovats retention indices. In gas chromatography, Kovats retention index is used to convert retention times into system-independent constants. The retention index of a chemical compound is retention time interpolated between adjacent n-alkanes. While retention times vary with the individual chromatographic system, the derived retention indices are quite independent of these parameters and allow comparing values measured under varying conditions. Tables of retention indices are used to identify peaks by comparing measured retention indices with the tabulated values. Based on the approximation that, under programmable temperature conditions, actual retention time of members of the homological series increases linearly with an increase in the number of carbon atoms, the linear retention index is a dimensionless number showing (on a linear scale) the retention of compounds relative to the series of the n-alkane mixture used.
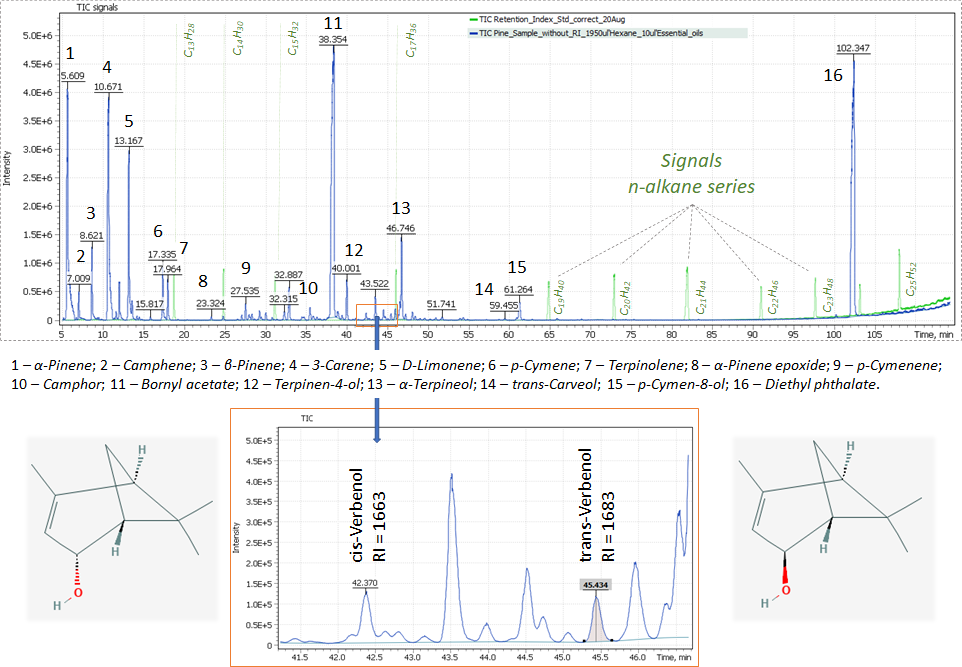
The linear index method is very informative and convenient and widely used in qualitative analysis of complex mixtures, in particular, such as the identification of oil components, volatile and medium-volatile compounds in biogenic samples, as well as in the analysis of essential oil components. Figure 1 shows separation and individual identification for two stereoisomers of verbenol (2-pinene-4-ol), a pair of stereoisomeric bicyclic compounds of monoterpenes (cis – and trans-isomers). For cis- isomer, the two methyl groups (- CH3) are on the same side of the carbon ring as the hydroxyl group (- OH), and for the trans- isomer, they are on the opposite sides.
Calibration of linear retention indices for a mixture of n-alkanes and their calculation for the identified components of the test sample were done in AMDIS software (NIST, USA). The relative components concentration calculation in the hydrolate samples was done by internal normalization method, using proprietary Maestro-Analyst software (Q-Tek, Montenegro).
The Total Ion Chromatogram plotted for earlier described data acquisition conditions of the used instrumental method and containing peaks of the main terpene compounds of pure essential oil of Common pine (Pinus sylvestris) is shown in Figure 1.
Fig. 1. Chromatogram for pure Common pine (Pinus sylvestris) essential oil extract.
Results and Discussion
Analysis of pure essential oil
Qualitative analysis results of pine (Pinus sylvestris) pure essential oil is presented in Table 2. Indvidual compound identification was done by NIST20 mass spectrum library. A peak was considered identified when both criteria had been met, namely – the degree of similarity of extracted experimental mass spectrum of respective compound to the library mass spectrum of the compound was above 75%, and relevant experimentally calculated linear retention index deviated within 35 units from its tabulated reference value. Thus, we were able to identify 58 individual compounds in the sample of essential oil.
Табл. 2. Qualitative analysis of Pine (Pinus sylvestris) pure essential oil sample.
| # | RT, min | Compound name | Formula | Match
Score |
RI
Reference |
RI
sample |
ΔRI
(ref – sample) |
| 1 | 5.6 | α-Pinene | C10H16 | 861 | 1052 | 1082.1 | -30.1 |
| 2 | 7.01 | Camphene | C10H16 | 932 | 1074 | 1106.6 | -32.6 |
| 3 | 8.62 | β-Pinene | C10H16 | 916 | 1099 | 1133 | -34 |
| 4 | 9.32 | 4(10)-Thujene | C10H16 | 873 | 1124 | 1145 | -21 |
| 5 | 9.47 | 2,4(10)-Thujadiene | C10H14 | 907 | 1124 | 1147.6 | -23.6 |
| 6 | 10.67 | 3-Carene | C10H16 | 846 | 1147 | 1165 | -18 |
| 7 | 11.39 | α-Phellandrene | C10H16 | 895 | 1167 | 1179 | -12 |
| 8 | 11.61 | β-Myrcene | C10H16 | 930 | 1161 | 1183 | -22 |
| 9 | 11.99 | 1,3,5-Cycloheptatriene, 3,7,7-trimethyl- | C10H14 | 920 | N/A | 1188.9 | N/A |
| 10 | 13.17 | L-Limonene | C10H16 | 927 | 1199 | 1207.2 | -8.2 |
| 11 | 13.58 | β-Phellandrene | C10H16 | 914 | 1211 | 1215.1 | -4.1 |
| 12 | 14.79 | Benzene, isobutyl- | C10H14 | 873 | 1238 | 1238 | 0 |
| 13 | 15.82 | γ-Terpinene | C10H16 | 927 | 1246 | 1252.1 | -6.1 |
| 14 | 17.34 | p-Cymene | C10H14 | 951 | 1272 | 1275.2 | -3.2 |
| 15 | 17.67 | Isoterpinolene | C10H16 | 924 | 1286 | 1282.7 | 3.3 |
| 16 | 17.95 | Terpinolene | C10H16 | 921 | 1283 | 1287.3 | -4.3 |
| 17 | 19.23 | o-Cymene | C10H14 | 907 | 1275 | 1307.9 | -32.9 |
| 18 | 23.33 | α-Pinene epoxide | C10H16O | 919 | 1384 | 1375.3 | 8.7 |
| 19 | 24.79 | Fenchone | C10H16O | 846 | 1399 | 1399.5 | -0.5 |
| 20 | 26.69 | Perillen | C10H14O | 772 | 1429 | 1429.9 | -0.9 |
| 21 | 27.07 | Benzene, 1-methyl–3–(1-methylethenyl)- | C10H12 | 936 | 1440 | 1435.4 | 4.6 |
| 22 | 27.54 | p-Cymenene | C10H12 | 949 | 1444 | 1443 | 1 |
| 23 | 27.96 | cis-Limonene oxide | C10H16O | 827 | 1452 | 1448.3 | 3.7 |
| 24 | 28.35 | α-Longipinene | C15H24 | 925 | 1525 | 1456 | 69 |
| 25 | 29.48 | Ylangene | C15H24 | 900 | 1491 | 1473.8 | 17.2 |
| 26 | 30.05 | Copaene | C15H24 | 919 | 1492 | 1483 | 9 |
| 27 | 30.82 | Fenchyl acetate | C12H20O2 | 916 | 1466 | 1494 | -28 |
| 28 | 32.34 | Camphor | C10H16O | 863 | 1518 | 1516.2 | 1.8 |
| 29 | 35.47 | Longifolene | C15H24 | 935 | 1577 | 1557.8 | 19.2 |
| 30 | 36.33 | trans-beta-Copaene | C15H24 | 900 | 1589 | 1568.8 | 20.2 |
| 31 | 37.60 | β-Copaene | C15H24 | 843 | 1586 | 1586 | 0 |
| 32 | 37.99 | Bornyl acetate | C12H20O2 | 928 | 1580 | 1591 | -11 |
| 33 | 38.90 | Fenchol | C10H18O | 880 | 1582 | 1603 | -21 |
| 34 | 39.41 | Anisole, 2-isopropyl-5-methyl- | C11H16O | 880 | 1590 | 1611 | -21 |
| 35 | 40.00 | Terpinen-4-ol | C10H18O | 928 | 1593 | 1618.8 | -25.8 |
| 36 | 41.09 | Myrtenal | C10H14O | 897 | 1633 | 1647 | -14 |
| 37 | 42.16 | trans-p-Mentha-2,8-dienol’ | C10H16O | 824 | 1647 | 1639 | 8 |
| 38 | 42.38 | cis-Verbenol’ | C10H16O | 804 | 1663 | 1651 | 12 |
| 39 | 43.98 | Crypton | C9H14O | 903 | 1687 | 1672 | 15 |
| 40 | 44.52 | Estragole’ | C10H12O | 885 | 1670 | 1679 | -9 |
| 41 | 44.75 | γ-Muurolene | C15H24 | 823 | 1692 | 1682 | 10 |
| 42 | 45.07 | cis-p-Mentha-2,8-dien-1-ol | C10H16O | 835 | 1652 | 1686 | -34 |
| 43 | 45.43 | trans-Verbenol | C10H16O | 932 | 1683 | 1691.3 | -8.3 |
| 44 | 46.74 | α-Terpineol | C10H18O | 859 | 1697 | 1707 | -10 |
| 45 | 47.24 | α-Muurolene | C15H24 | 938 | 1726 | 1712.3 | 13.7 |
| 46 | 48.09 | 2-Caren-4-ol | C10H16O | 904 | NA | 1720.8 | N/A |
| 47 | 48.44 | Carvone | C10H14O | 772 | 1740 | 1725 | 15 |
| 48 | 49.03 | α-Phellandren-8-ol | C10H16O | 888 | 1778 | 1709 | -22.0 |
| 49 | 54.35 | Myrtenol | C10H16O | 917 | 1796 | 1788 | 8 |
| 50 | 59.41 | trans-Carveol | C10H16O | 923 | 1845 | 1842 | 3 |
| 51 | 60.84 | m-Cymen-8-ol | C10H14O | 902 | 1845 | 1858 | -13 |
| 52 | 61.27 | p-Cymen-8-ol | C10H14O | 941 | 1852 | 1860.2 | -8.2 |
| 53 | 62.82 | cis-Carveol | C10H16O | 730 | 1861 | 1878 | -17 |
| 54 | 65.90 | (-)-Car-3-en-2-one | C10H14O | 944 | 1881 | 1911.2 | -30.2 |
| 55 | 75.37 | Methyleugenol | C11H14O2 | 863 | 2013 | 2027 | -14 |
| 56 | 92.88 | p-Cymen-2-ol | C10H14O | 901 | 2236 | NA | N/A |
| 57 | 100.24 | 1-Ethyl 2-methyl phthalate | C11H12O4 | 873 | 2315 | 2346 | -31 |
| 58 | 102.52 | Diethyl phthalate | C12H14O4 | 879 | 2366 | 2378.2 | -12.2 |
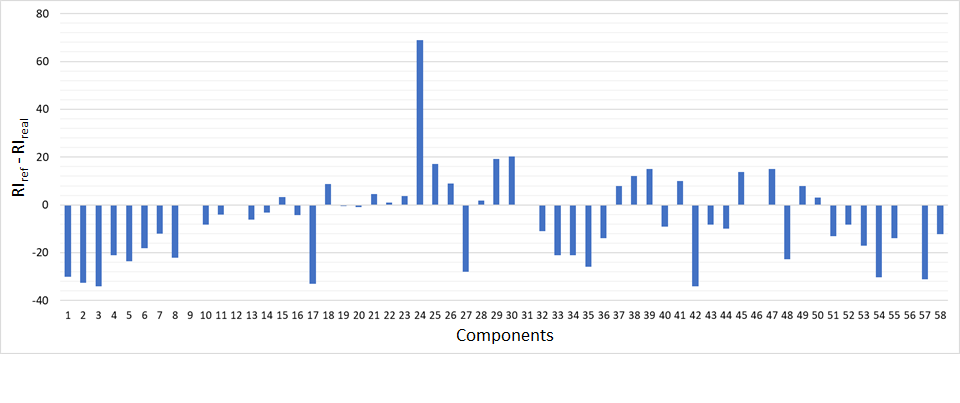
The rightmost column of Table 2 shows the difference between the expected reference values of linear retention index (RI reference) and experimentally obtained ones (RI sample). Some components are noted for a fairly accurate measurement of their retention indices (2-3 index units), while the others showed up to 30 index units deviations on average in this study. However, the accuracy and reproducibility of retention indices are rarely observed, usually reproducibility of the indices is lower than expected and is very much in line with results obtained in this work (Fig. 2). This phenomena is explained by differences in capillary column i.d. used, by differences in stationary phase film thickness of the columns, resulting in different adsorption/desorption kinetics of the compounds of interest, and therefore, deviations in their experimentally obtained index values. For some compounds, retention indices could not be calculated due to the lack of reference values for a polar column in NIST20 mass spectrum library.
Fig. 2. Graph of the linear retention indices deviation – expected vs experimental ones.
Analyzing pure essential oil had become a basis for development and validation of approaches to essential oil extracts analyses used later in this study. The single-stage liquid-liquid extraction of the sample permitted to eliminate possible technical errors and sample loss. The use of linear retention indices provided additional degree of confidence in correct interpretation of experimental mass spectra, as well as help to spot out potential errors for the obtained RI values on specific type of polar chromatographic column.
Analysis of hydrolates
The proven method of extraction and qualitative analysis experimental data from pure essential oil sample was used for analysis of coniferous tree hydrolates (designated and hereinafter referred to as: HKS-sample and BK-sample). Figure 3 shows the chromatograms of sample extracts used for laboratory comparison tests. The purpose of the second part of this study was to search for biological markers that could be later used as targets for sample discrimination.
Fig. 3. Total Ion Chromatograms of hydrolate samples extracts (2 sample groups-HKS and BK)
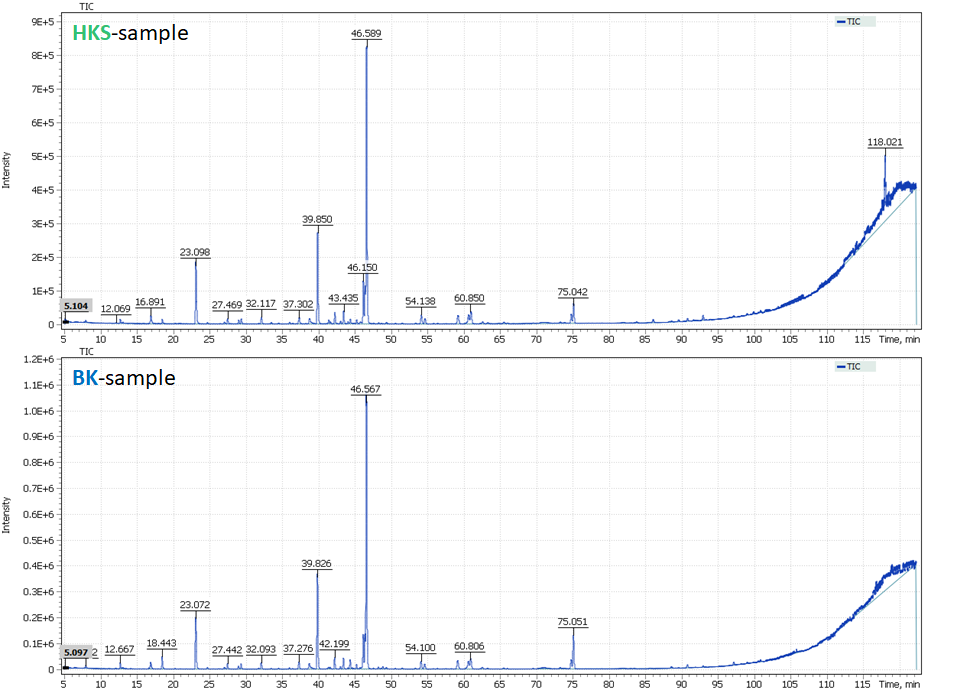
The figure 3 shows the profiles of two samples to be quite similar. 48 compounds were identified in BK – hydrolate sample group. The main components are alpha-terpinol (40.0%), terpinen-4-ol (12.9%), 1-hexanol (7.1%), methylevgenol (5.6%), verbenone (4.7%), p(m)-cymen-8-ol (4.3%), carveol (2%). 54 compounds were identified in HKS – hydrolate sample group. The main components of the HKS-hydrolate samples were much similar to those found in the BK-hydrolate samples, namely: alpha-terpinol (41.0%), terpinene-4-ol (12.2%), 1-hexanol (8.2%), levoverbenone (5.4%), verbenone (3.2%), p(m)-cymene-8-ol (4.5%), carveol (2%). That is, due to the high content of alpha-terpinol (40.0%) and turpin-4-ol (12.5%), oxygen derivatives of monoterpenes – monoterpenoids – predominate in both hydrolate samples. Obviously, without deep and detailed analysis, discrimination between the two hydrolate samples is a challenge.
To overcome such a challenge, various methods of statistical comparison of experiments are often used, in order to recognize possible (non-obvious) patterns with calculated statistical significance.
In statistics, such a method is often called A / B testing (split testing or statistical hypothesis testing), where one of the test objects is called a control object, and it is compared with the tested object by a set of features, numerically expressed by some quantitative metric. As a result, the task is transformed into a mathematical algorithm that helps to understand if the metric differences between the compared objects (groups) are not random but can be associated with changes in the metric of an object. In other words, is the change in the metric of one object statistically significant or not.
In a GC-MS experiment the object of such testing can be a test sample, and a set of integrated peaks in the sample are its features. As a metric, it is possible to use peak areas for the detected compounds, however in this case influence of extraneous factors on the accuracy of the analysis is difficult to estimate (for example, the accuracy of sample dosing, the accuracy of GC flow control, etc.), so far better idea is to use values of signal ratios to the maximum peak in the chromatographic profile, instead.
Simple and fast algorithms for batch processing of data for subsequent statistical analyses are implemented in “Maestro-Analyst” software (Q-Tek), in particular, automatic integration of experimental data of hydrolate samples acquired in full scan mode. The integration algorithm automatically detects chromatographic signals in the exracted ion chromatogram profile, then groups the signals by their retention times to forms mass spectra of the detected compounds, clean off the chemical background. Finally, the algorithm does a search through mass spectral libraries for presence of similar spectra and subsequent interpretation of the matches found. The list of best matches can be exported into any external software, via open data format *.csv, which is very convenient when there is a need for further processing of “raw” data by a specialty third-party software. The alignment of chromatographic peak retention times was performed in R computing environment, designed specifically for mathematical modeling and graphical representation of data. The final data processing and the construction of the resulting diagrams were carried out in Python computing environment.
As a resulting diagram, we used a dot diagram (a kind of volcano plot), which would allow combining the measurement of statistical significance (p-value) and the range of changes (Fold Change), having these changes highlighted visually through a large range of differences with statistically significant indicators. Notably, the volcano diagram is popular in “omics” studies, such as genomics, proteomics and metabolomics, where large number of repeats is often used and it is necessary to quickly identify significant differences. The resulting dot diagram (volcano plot) of comparing two samples is shown in Figure 4.
The statistical significance of the difference (negative logarithm) is indicated on the Y axis of the diagram, and the range of changes is indicated on the X axis. As you can see, the advantage of using this type of diagram is precisely in combination of measurements, which helps to quickly visually identify significant differences between the analyzed features of the objects under study.
Fig. 4. A dot diagram (volcano plot) comparing composition two hydrolate samples extracts.
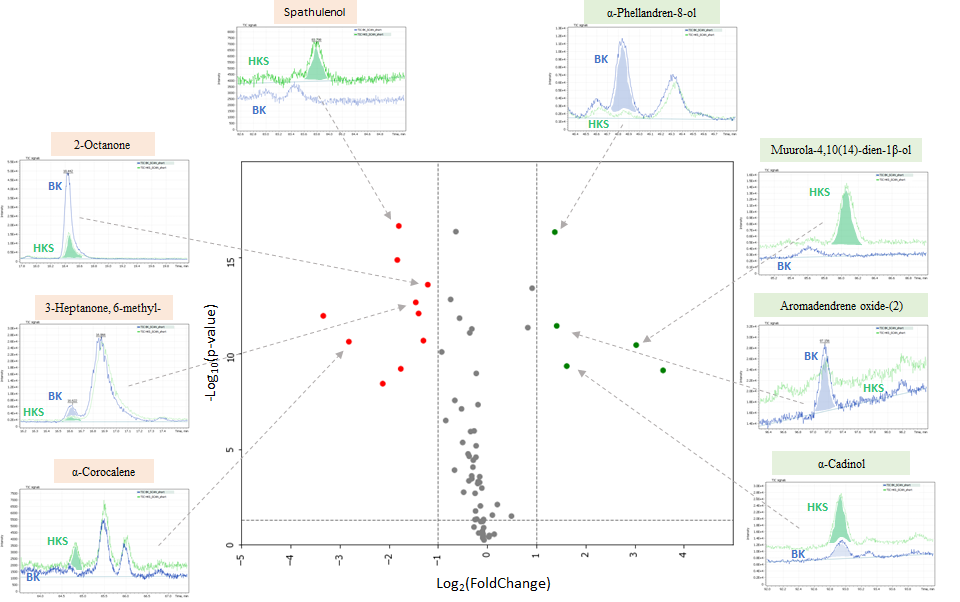
It is quite simple to interpret the results of such a diagram. The red and green dots, respectively, show large ranges of variation and high statistical significance being reliable markers of differences between objects. The dotted line along the X axis indicates the lowest value of significance level (p = 0.05), the points above this line respectively have p < 0.05, the points below p > 0.05. Gray dots, even those having p < 0.05, but whose range of changes is less than 2 (log2 = 1), are not recommended to be a reliable marker of difference.
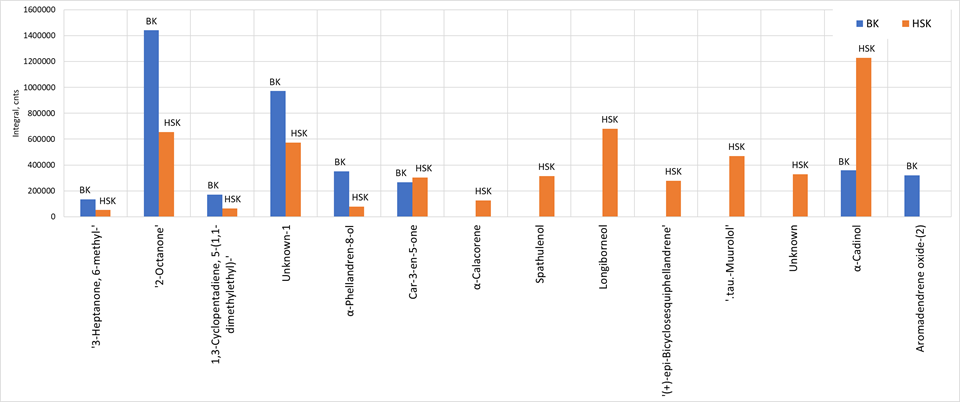
Table 3 shows a list of selected markers that could later be used as targets for objects comparison and similarity numerical assessment. The diagram in Figure 5 shows histogram of the selected markers peak areas, that demonstrates significant differences in their content in the analyzed samples.
Табл. 3. List of selected markers of difference between two samples of hydrolates.
| Compound name | Formula | Average peak area in BK sample | Average peak area in HKS sample | p-value |
| 3-Heptanone, 6-methyl- | C8H16O | 134785.76 | 51825.00 | 2.23E-13 |
| 2-Octanone | C8H16O | 1440331.64 | 655694.62 | 2.65E-14 |
| 1,3-Cyclopentadiene, 5-(1,1-dimethylethyl)- | C9H14 | 171815.72 | 65634.44 | 8.43E-13 |
| Unknown-1 | – | 970968.26 | 572905.96 | 1.12E-12 |
| α-Phellandren-8-ol | C10H16O | 351501.18 | 79726.64 | 4.76E-17 |
| Car-3-en-5-one | C10H14O | 268047.82 | 304163.12 | 1.36E-15 |
| α-Calacorene | C15H20 | – | 127524 | 2.50E-11 |
| Spathulenol | C15H24O | – | 315011.52 | 2.28E-17 |
| Longiborneol | C15H26O | – | 679752.08 | 3.77E-11 |
| (+)-epi-Bicyclosesquiphellandrene | C15H24 | – | 279351.04 | 3.90E-09 |
| .tau.-Muurolol | C15H26O | – | 470212.82 | 2.21E-11 |
| Unknown-2 | – | – | 329890.04 | 6.54E-10 |
| α-Cadinol | C15H26O | 358731.54 | 1228785.78 | 4.72E-10 |
| Aromadendrene oxide-(2) | C15H24O | 319270.18 | – | 3.74E-12 |
| Unknown-3 | – | – | 9125047.15 | 7.91E-10 |
Fig. 5. Histogram of selected markers’ peak areas for two hydrolate sample groups.
Conclusion
Essential oils are both an important product and source material for many industries and medicine. In practice, a number of problems arise related to authenticity confirmation, adulteration and the quality assessment of the essential oils prior to their application. The analysis of essential oils by gas chromatography-mass spectrometry demonstrated effective use of Q-Tek GC-MS for both qualitative analysis of pure essential oil, including minor components, and discriminative analysis in order to find markers that could later be used as targets for sample similarity assessment.
Use of linear retention indices reduces room for incorrect compound identification during interpretation of mass spectra. This becomes especially important for qualitative analysis of essential oil samples containing high number of isomeric compounds.
The Q-Tek GC-MS used in this study has demonstrated reliability and fully met analytical requirements wanted for both complex analyses of pure essential oils samples having relatively high concentrations of analytes of interest, and for equally complex dilute hydrolates with the analytes their at low concentrations. Fast data processing tools used in Q-Tek Maestro-Analyst proprietary software ensured reliable detection and identification of many components of complex mixtures, provided ability to seamlessly import the initial results via open data format into external specialized freeware for their further processing in powerful computing environment.
Literary references
- Рощина В. Д., Рощина В. В. Выделительная функция высших растений. М., 1989. 214 с.
- Лолойко А.А, Невкрытая Н.В., Петришина Н.Н, Марченко М.П. Особенности биосинтеза эфирного масла в семенном потомстве полыни эстрагон (Artemisia dracunculus L.).
- Бордина Г.Е., Лопина Н.П., Некрасова Е.Г., Бууева А.И., Майорова Е.И. Определение качества эфирных масел. DOI: 10.18454/IRJ.2016.49.038., Международный научно-исследовательский журнал, Екатеринбург 2016.
- Хейфиц Л.А., Дашунин В.М. Душистые вещества и другие продукты для парфюмерии. М.: Химия, 1994. 226 с.
- Shaaban H.A.E., El-Ghorab A., Shibamoto T. Bioactivity of essential oils and their volatile aroma components: Review // J. Essent. Oil Res. 2012. V. 24, № 2. P. 203–212.
- Мировое производство эфирных масел
- Государственная фармакопея Российской Федерации. Т. 2. Общие методы анализа. Изд. XIII-е, доп. М.: Научный центр экспертизы средств медицинского применения, 2018. С. 2284.
- И.П. Рудакова и др. Методы контроля качества эфирных масел // Фармация. 2005. № 3. С. 3–5.
- Bakkali et al. Biological effects of essential oils – a review // Food Chem. Toxicol. 2008. V. 46. P. 446–475.
- Аюпова Р.Б., Сакипова З.Б., Дильбарханов Р.Д. Эфирные масла: достижения и перспективы, современные тенденции изучения и применения // Вестник КазНМУ. 2013. Т. 5. С. 74.
- Sarkis A., Stappten I. Essential Oils and Their Single Compounds in Cosmetics – A Critical Review // Cosmetics. 2018. V. 5, № 11. P. 1-21.
- Tongnuanchan P., Benjakul S. Essential Oils: Extraction, Bioactivities, and Their Uses for Food Preservation // J. Food Sci. 2014. V. 79, № 7. P. R1231-R1248.
- E. Asbahani et al. Essential oils: From extraction to encapsulation // International Journal of Pharmaceutics. 2015. V. 483. P. 220-243.
- Rubiolo et al. Essential Oils and volatiles: sample preparation and analysis // Flavour Fraagr. J. 2010. V. 25. P. 282-290.
- В.И. Чуешов и др. Технология лекарств промышленного производства: учеб. для студ. высш. учеб. завед.: перевод с укр.: в 2 ч. Ч.1 / Винница: Нова Книга, 2014. 696 с.
- Стандарты по ISO/TC 54. Essential oils.
- EOA Book of Standards and Specification. Essential Oil Association of U.S.A. 1978. 582 p.
- Setting the standard for safe use of fragrance materials.
- Research institute for fragrance materials.
- British Pharmacopoeia: British Pharmacopoeia Commission Laboratory London. 2009.
- ГОСТ 31791–2017. Эфирные масла и цветочно-травянистое эфиромасличное сырье. Технические условия. М., 2018. 19 с.
- Howes M.-J.R., Simmonds M.S.J., Kite G.C. Evaluation of the quality of sandalwood essential oils by gas chromatography–mass spectrometry // J. Chromatogr. A. 2004. V. 1028. P. 307–312.
- Sciarrone et al. Application of a multidimensional gas chromatography system with simultaneous mass spectrometric and flame ionization detection to the analysis of sandalwood oil // J. Chromatogr. A. 2011. V. 1218. P. 137–142.
- J. Beale et al. Chemometric Analysis of Lavender Essential Oils Using Targeted and Untargeted GC-MS Acquired Data for the Rapid Identification and Characterization of Oil Quality // Molecules. 2017. V. 22. P. 1339.
- Л. Сояк. Разделение и идентификация изомерных углеводородов методами капиллярной газовой хроматографии и сочетаниями ее с масс-спектрометрией и ИК-Фурье-спектроскопией. УДК 543.544 (547.31)