Introduction
Vitamin E – is a group of fat-soluble natural compounds derived from tocol, the most important compounds of which are 4 forms of tocopherol and 4 forms of tocotrienol (α, β, γ, δ, respectively). Each of them exists in eight different stereoisomeric configurations — RRR, RSR, RRS, RSS; SRR, SSR, SRS, SSS, which differ in the position of the methyl groups in the positions C2, C4 and C8 of the side chains (Fig. 1). Tocopherols of natural origin are found only in the RRR configuration, but synthetic α-tocopherol consists of an equilibrium racemic mixture of all eight stereoisomers. Also, the molecular structure of the compound consists of a chromanolic ring and a saturated side chain (Approx. tocotrienols are characterized by an unsaturated side chain) [1]. The differences in the structural forms of tocopherols depending on the position of the methyl groups around the chromanolic ring are shown in Figure 1 (Table).
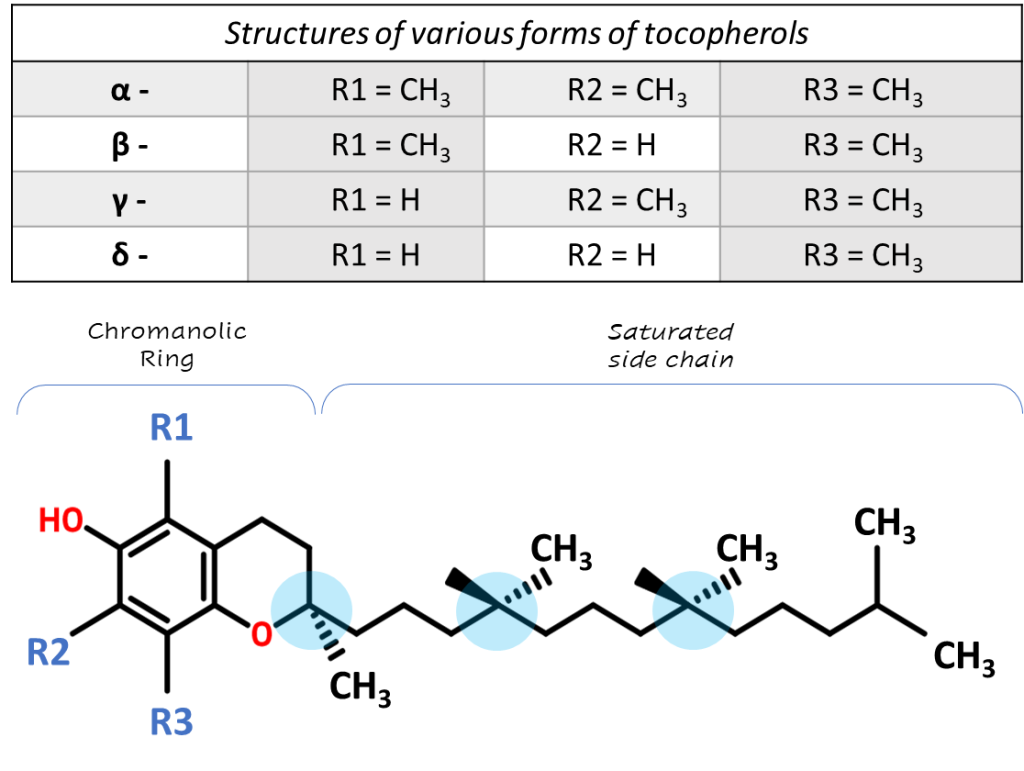
Fig. 1. The structure of tocopherol, as well as structural differences among tocopherol forms
Vitamin E was discovered by Herbert Evans and Catherine Bishop at the University of Berkeley (California) in 1922. The researchers found that the rats fed semi-synthetic food actively grew, but they were not able to reproduce offspring, as the embryos resorbed before the end of pregnancy. Only after the diet was supplemented with fresh green lettuce leaves or dried lucerne leaves, which contain vitamin E, in sterile rats, a relatively rapid recovery of reproductive function was observed [2-4]. For the first time, the chemical structure of vitamin E was determined by the Swiss chemist Paul Karrer in 1935, and in 1938 he synthesized it [5]. The common name of vitamin E, as “tocopherol” was proposed by George Calhoun, professor of Greek at the University of California [3, 5]. The first part of the word comes from the Greek term tocos (τόκος) – “childbirth”, and the particle phero (φέρω) is translated as “gestation”, the ending “-ol” indicates the presence of an alcohol group in the molecule.
The first therapeutic use of vitamin E was noted in 1938 by Dr. Wiedenbauer, who used wheat germ oil as a supplement for 17 premature newborn infants suffering from growth disorders. As a result of the study, 11 infants recovered and were able to resume normal growth rates. [5] Subsequently, in 1968, vitamin E was proposed to be used as an antioxidant to protect cellular lipids from free radicals with an initial recommended RDA of 30 international units (IU).
Metabolism and function of vitamin E in the body
Vitamin E is not produced in the body and comes from food. It is found in vegetable oils (soy, sea buckthorn, corn), sprouted wheat and corn grains, legumes, eggs, sea fish, greens (spinach, watercress), avocados and nuts (peanuts, almonds).
Entering the gastrointestinal tract with oil, vitamin E is released due to hydrolysis by lipase and esterase. In the intestine, vitamin E is absorbed with the participation of bile acids and enters the lymphatic system as part of chylomicrons, and then into the blood (Fig. 2). Only after passing through the liver, α-tocopherol appears in the plasma. Most other beta-, gamma-, and delta-tocopherols are almost completely excreted in the bile or are not absorbed into the intestine and are excreted in the feces. More details on metabolism of tocopherols can be found elsewhere [6]
Until recently, most vitamin E research has focused primarily on the study of α-tocopherol [8], because α-tocopherol is the predominant form of vitamin E in tissues, but relatively recent studies have shown that γ-tocopherol is also much important element in human life.
Studies have shown that γ-tocopherol is highly active in trapping lipophilic electrophiles and active forms of nitrogen and oxygen, thus complementing the action of glutathione, which also recycles electrophilic mutagens in the aqueous phase of cells. Therefore, γ-tocopherol can protect lipids, DNA, and proteins from peroxynitrite-dependent damage (oxidation by the active form of nitrogen). The results of several studies also suggest that only the level of γ-tocopherol in plasma serves as a biomarker of cancer and the risk of cardiovascular diseases [12].
Tocopherol is not only an excellent antioxidant, but also an antihypoxant, due to its ability to stabilize the mitochondrial membrane and save oxygen consumption by cells. It should be noted that of all cellular organelles, mitochondria are the most sensitive to damage, since they contain a large amount of easily oxidized unsaturated lipids. Due to the membrane-stabilizing effect of vitamin E in mitochondria, the conjugation of oxidative phosphorylation, the formation of ATP and creatine phosphate increases. It is also important to note that vitamin E allows to control the biosynthesis of ubiquinone, a component of the respiratory chain and the main antioxidant of mitochondria.
Vitamin E is involved in the immune function as an effective immunomodulator that helps to strengthen the immune defenses of the body.
Vitamin E – rich endothelial cells lining the inner surface of blood vessels are better able to resist the components of blood cells that adhere to this surface. At the same time, tocopherol also helps to increase the expression of two enzymes that suppress arachidonic acid metabolism, thereby increasing the release of prostacyclin from the endothelium, which, in turn, dilates blood vessels and suppresses platelet aggregation [7].
In addition, according to the literature, additional enrichment of the body with α-tocopherol reduces the efficiency of absorption of α-tocopherol itself but does not affect the content of γ-tocopherol, which leads to the conclusion that α- and γ-tocopherol does not compete during absorption [13]. Also, in studies involving 21 adults, a dose of 100 mg of naturally occurring isotopically labeled γ-tocopherol increased plasma levels of γ-tocopherol directly by 2.6 times, without affecting the concentration of α-tocopherol [14].
The level of vitamin E in the body
As noted earlier, the concentration of vitamin E in human plasma depends largely on the work of the liver, which absorbs nutrients after absorption of various forms of vitamin from the small intestine. Since the liver preferentially re-secretes only α-tocopherol via the hepatic carrier protein, while metabolizing and excreting mostly other forms of tocopherol, the results of the concentrations of β- and γ- forms of tocopherol in the blood and cells are correspondingly lower than α-tocopherol, while there is a rather small number of scientific publications and calculations of their relative concentrations. The conducted literature search allowed us to determine several reference values from various available publications [9-11].
Table 1. Reference values of tocopherols in human plasma, ug/ml
| Compound | Reference values,
as per [9] |
Reference values,
as per [10] |
Reference values, as per [11] |
| α-tocopherol | 4,3 – 19,4 | 6,6 – 15,0 | 6,5 – 8.6 |
| β-tocopherol | – | 0 – 0,2 | – |
| γ-tocopherol | – | 0,7 – 2,7 | 0,9 – 3 |
Data on the consumption of γ-tocopherol is quite scattered, but in the literature, you can find several comparative studies on the diversity of the diet of the populations of the United States and Europe. In particular, in North America, the consumption of γ-tocopherol is estimated to exceed the consumption of α-tocopherol by 2-4 times [15, 16]. This is primarily due to the fact that the predominant vegetable oil in the diet of Americans is soy oil (76.4%), followed by corn oil and canola oil (both 7%) [17]. In Europe, rapeseed oil and sunflower seed oils are widespread, despite of the fact that southern European countries are widely known for their natural olive oils [18, 19]. These oils contain less γ-tocopherol, but more α-tocopherol compared to soy and corn oils consumed in the United States. Thus, the average level of γ-tocopherol in plasma of a European is several times lower than the average level of γ-tocopherol in Americans, which is clearly shown in Table 2 [12].
Table 2. The concentration of gamma-and α-tocopherol in the plasma of different people, living in different countries.
| Concentration in human plasma, depending on the country of residence | γ-tocopherol,
(µg/mL, plasma) |
α-tocopherol
(µg/mL, plasma) |
literary reference |
| USA | 2.32 | 9.60 | [20] |
| France | 0.40 – 0.55 | 11.50 | [21] |
| Ireland | 0.75 – 0.80 | 11.30 | [21] |
| Netherlads | 0.99 | 10.29 – 10.98 | [21] |
| Spain | 0.74 | 11.76 | [22] |
| Italy | 0.55 | 10.46 | [23] |
| Sweden | 1.30 | 10.25 | [24] |
| Austria | 0.64 | 9.09 | [25] |
Lack and overabundance of vitamin E
Vitamin E deficiency in male reduces the production of sperm, in female there is a violation of the menstrual cycle, miscarriages, a decrease in sexual desire. This vitamin is necessary for the normal development of the fetus during pregnancy, to maintain the hormonal background and participates in the formation of the fetal respiratory system, improves the maturation of the placenta, regulates its work and the condition of blood vessels, prevents detachment and other disorders, and also participates in the production of prolactin — a hormone that ensures lactation.
It is obvious that the lack of vitamin E leads to a violation of metabolism, a decrease in the ability of the blood to transfer oxygen, the development of local oxygen starvation. Also, with insufficient intake of vitamin E, there is an increased destruction of red blood cells associated with a violation of the stability of their membranes.
Symptoms of vitamin E overdose include headache, fatigue, gastrointestinal disorders, heart problems, double vision, and muscle weakness. Consuming large amounts of vitamin E also prevents the absorption of other fat-soluble vitamins: A, D, and K.
The aim of this study is to develop a fast, sensitive, and reliable method for quantification of 3 forms of tocopherol (α, β, ϒ) in human plasma for clinical research using the Q-Tek GC-QMS system.
Experimental
Materials and methods
Hexane, acetonitrile, ethanol, bi-distilled water – all the reagents used in the experiment were classified as particularly pure or “HPLC grade”. As a derivatization procedure, a silylation reaction was used to form trimethylsilyl derivatives using the MSTFA derivatizing agent in combination with ammonium iodide NH4I (the MSTFA/NH4I component ratio is 100%/0.2% (v/w)). The deuterated standards of 25-hydroxyvitamin D (6,19,19-d3) compounds were used as the internal standard. All the work was carried out using amber glass vials, to minimize photo- degradation of the target compounds.
Individual pure analytical standards of α-, β-, γ- tocopherols produced by Sigma-Aldrich were used as calibration standards. The prepared standard mixtures covered concentration ranges from 0.02 µg/mL to 37.88 µg/mL for the α-tocopherol, from 0.01 µg/mL to 12.63 µg/mL for the β-tocopherol, and from 0.001 µg/mL to 1.26 µg/mL for the γ-tocopherol. Such wide linear calibration ranges made it possible to fully cover all targeted forms of tocopherols and to avoid concentration (or dilution) of samples later.
Blood collection procedure and Tocopherol extraction
To test the method, we used samples of human plasma obtained from an accredited laboratory of the Institute of Analytical Toxicology. Centrifugation was used at 4000 rpm for 5 minutes to separate the plasma from blood. In cases where immediate analysis was not possible, the plasma samples were frozen.
To perform the analysis, 200 µl of plasma was used, which was placed in a 4 ml amber glass tube and 20 µl of an internal standard solution (in ethanol) was added to the test sample, followed by addition of 200 µl acetonitrile to the mixture. The resulting mixture was placed in the refrigerator at 4°C for 10 minutes to precipitate proteins.
Next, 1.0 ml of hexane was added to the cooled mixture, then the resulting bipolar mixture was vortexed. To improve mixing, an orbital shaker was used for 5 minutes at 220 RPM.
After centrifugation of the mixture, a 0.6 ml aliquote of supernatant hexane layer was sampled, transferred to another vial and, then, evaporated to dryness in thermostat at 69°C for 40 minutes.
Derivatization
50 µl of silylating reagent (100% MSTFA + 0.2% NH4I, v/w) was added to the dry residue, the vial was then placed in a thermostat at 60°C for 40 minutes. 1.0 µl of the resulting derivative was injected into the GC-MS system.
Gas chromatography and mass spectrometry
Mass spectrum and signals of fragment ions were obtained by the GC-QMS system (Q-Tek D.O.O., Montenegro). EI source was operated at 230°C and 70 eV ionization energy was applied. Full-scan data (m/z 150-520 Da) were obtained to identify the structural characteristics of the fragment ions of the target compounds. The fused silica capillary column BPX5 (Trajan cat # 054101) was applied to separate forms of Tocopherol.
The operating parameters of the GC system and the operating modes of the MS are presented in Table 3 and 4, respectively.
Table 3. Instrumental method parameters.
| Instrument | |
| GC-MS system | Q-Tek D.o.o., Montenegro |
| Inlet type | Split/Splitless, Constant Flow |
| Liner | Split Liner w/quartz wool:
Trajan Cat# 092001 (4 mm x 6,3 x 78,5) |
| GC column | BP5X (30m x 0,25mm; 250um) |
| GC separation parameters | |
| Injected volume | 1,0 uL |
| Inlet mode | Split mode, 10:1 |
| T° of Inlet | 280°C |
| Oven program | 160°C for 1,0 min;
25,0°C/min to 280°C, hold 1,2 min. 5,0°C/min to 310°C, hold 2,0 min; |
| Carrier gas flow | (He) 1,0 mL/min |
| T° of GC-MS transfer line | 280°C |
| MSD settings | |
| Ion source | EI, @ 230°C |
| Solvent delay | 8,0 min |
| SCAN parameters | 150 – 520 Da, 2000 Da/sec |
| SIM parameters | SIM (see below) |
The mass spectrum of the analytical standards of tocopherols (conc = 5 ppm) and the pathways of molecular fragmentation in the ion source are shown in Figure 4.
Fig. 2. Study of the mass spectrum of trimethylsilyl derivatives of target compounds.
Mass spectrum of trimethylsilyl derivatives of α-tocopherol
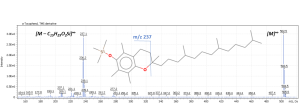
Mass spectrum of trimethylsilyl derivatives of β – and ϒ – tocopherol
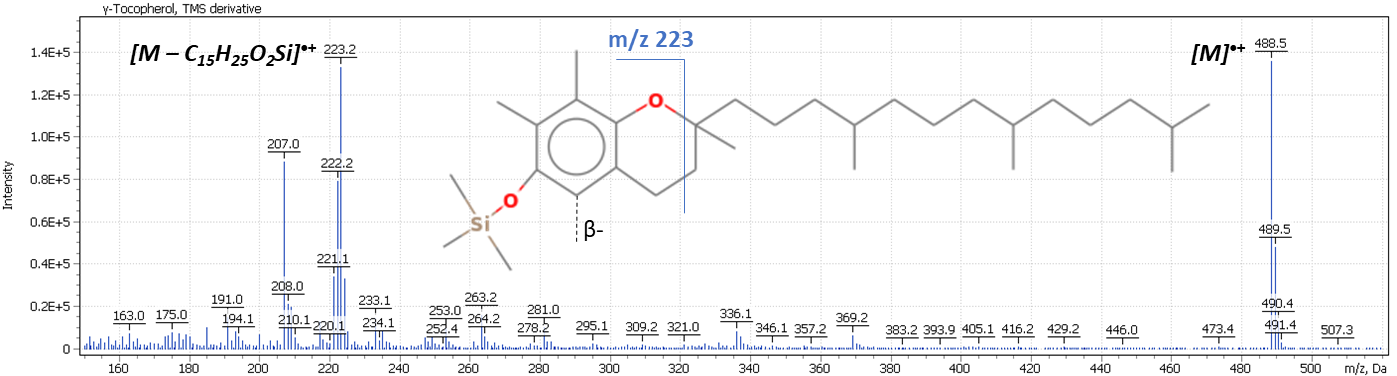
The signal of the molecular ion and the ion of the trimethylsilyl derivative of the chromanolic ring were chosen as fragment ions.
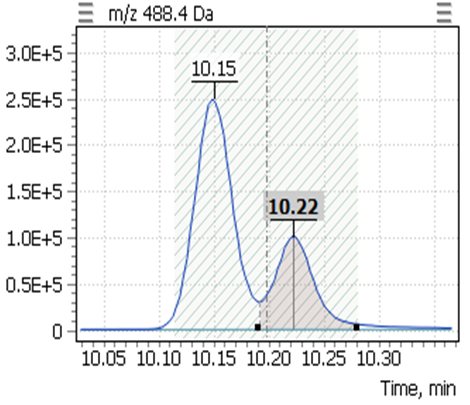
Table 4. The retention times of the target compounds, as well as the SIM parameters.
| № | List of derivatives | Quant ion | Qualifier-1 | RT, min |
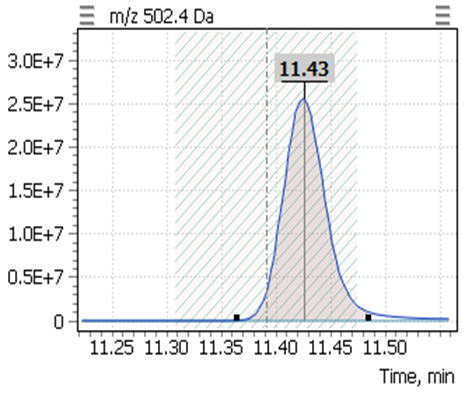
| 1 | α-tocopherol (-TMS) | 502,4 | 237,2 | 11,43 |
| 2 | β-tocopherol (-TMS) | 488,4 | 223,2 | 10,15 |
| 3 | γ-tocopherol (-TMS) | 488,4 | 223,2 | 10,22 |
| 4 | 25-hydroxycholecalciferol _d3 (D3) | 416,4 | 532,4 | 10,32 |
Linearity
Calibration curves for the studied forms of the tocopherol were built with a previously prepared standards mix. The ratio of peak area of a standard to the area of ISTD was used to quantify the concentration of compounds in the plasma.
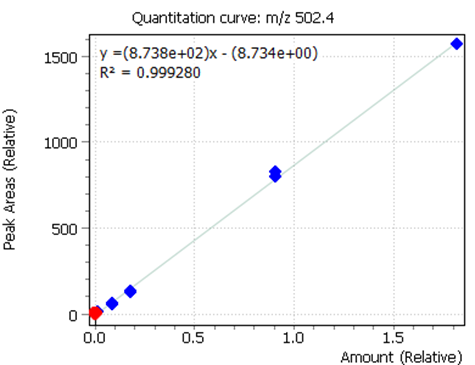
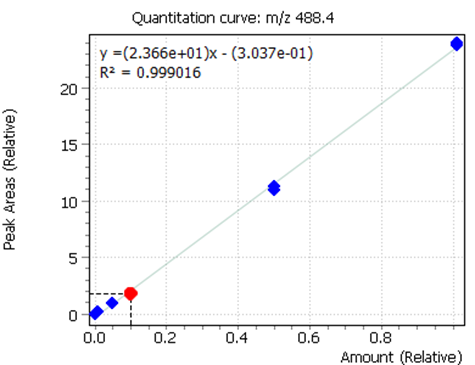
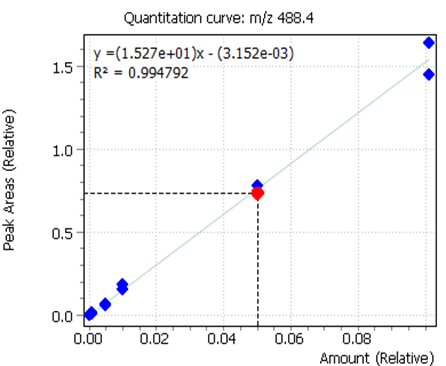
Fig. 3. Calibrations for 3 forms of the tocopherol and quant-ion peaks on EIC chromatograms.
| α-tocopherol | β-tocopherol | γ-tocopherol |
 |
 |
 |
 |
 |
 |
Results and Discussion
One important task during this work was to develop a common sample preparation procedure for the analysis of both tocopherols and 25-hydroxyvitamin D3 (see App Note-13/2020GCMS) in the same sample of blood. Based on the fact that the tocopherol compound also has active hydrogen in the hydroxyl group, the choice of the derivatization mechanism was based on the silylation of the molecule to its trimethylsilyl derivative. For a complete derivatization reaction, MSTFA/NH4I mixtures (100%/0.2% (v/w)) were used for 40 minutes at 60°C.
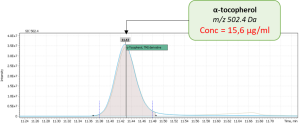
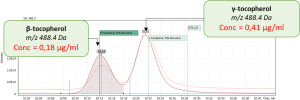
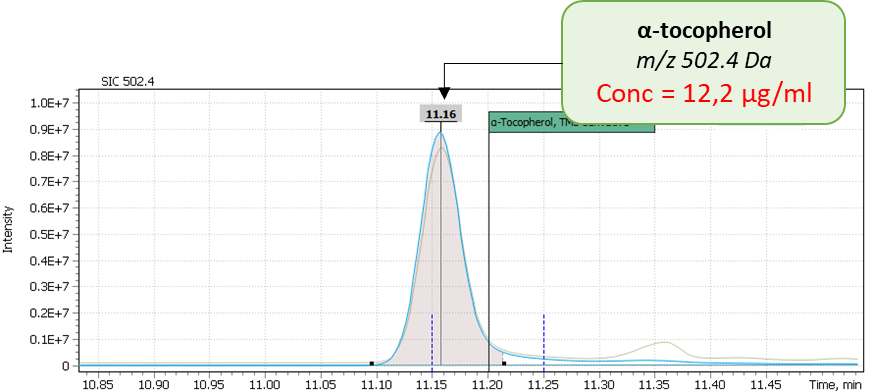
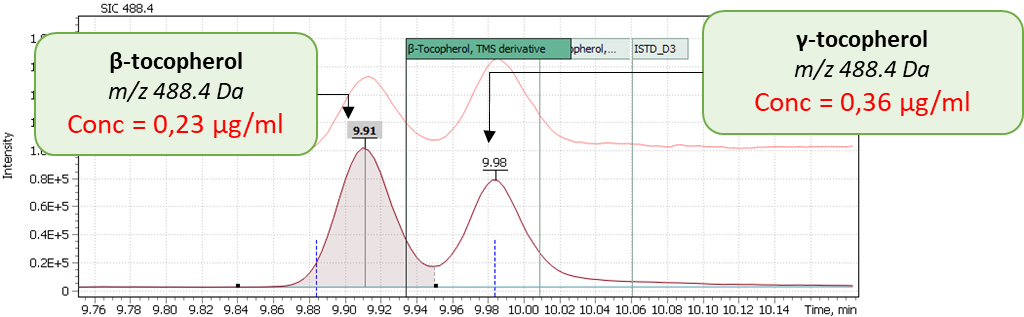
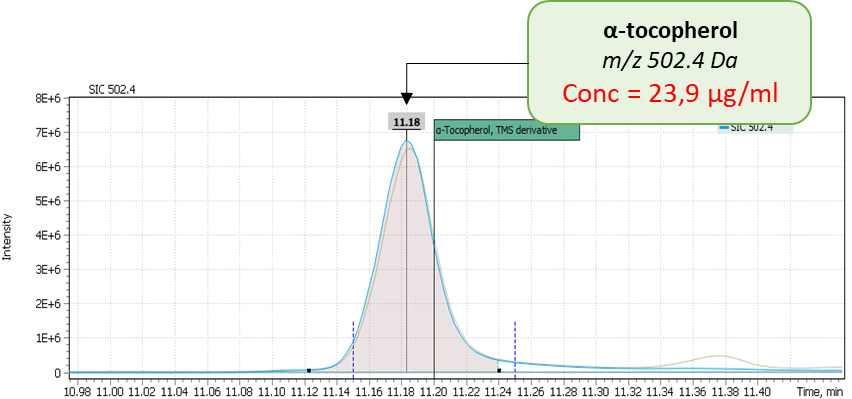
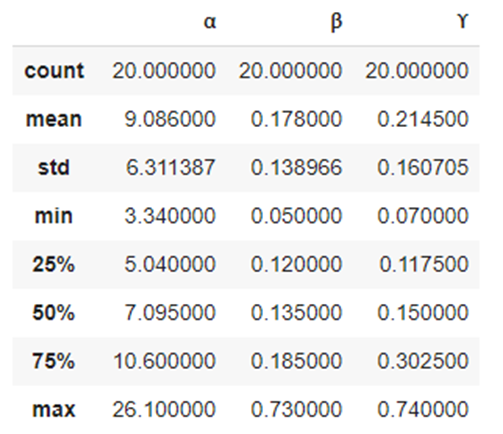
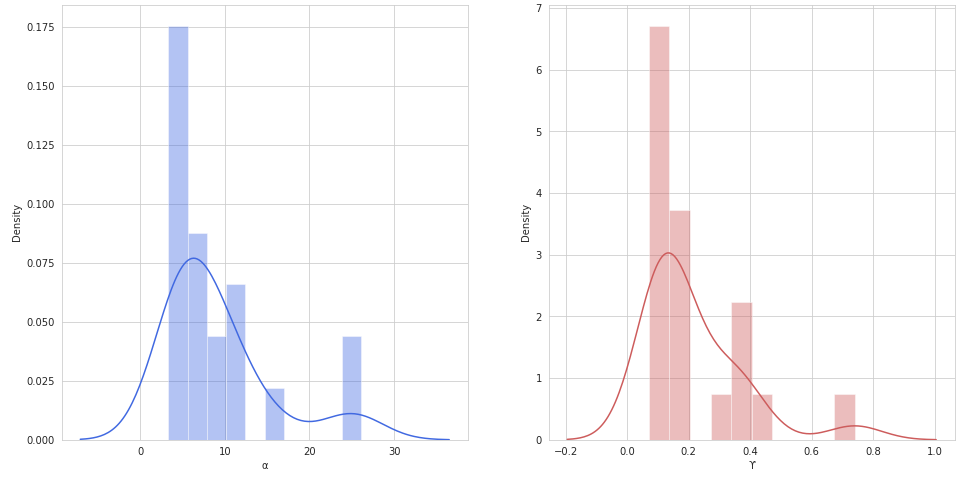
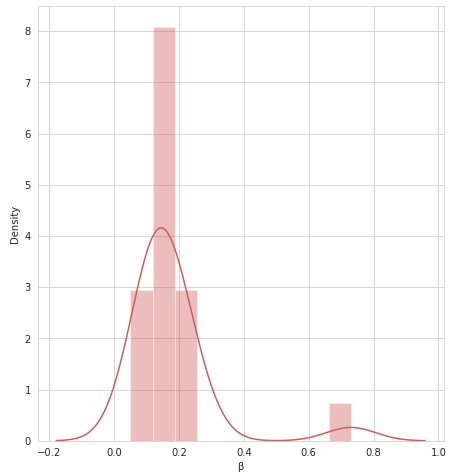
During validation of GC-MS method for quantification of tocopherol forms in plasma, samples from 20 anonymous individuals (9 male, 11 female) aged from 30 to 57 years were analyzed. It was noted that the average concentration of α-tocopherol was from 3.3 to 26.0 µg/mL (average 9.08), the concentration of β-tocopherol from 0.05 to 0.73 µg/mL (average 0.17), the concentration of γ-tocopherol from 0.07 to 0.74 µg/mL (average 0.21). The EIC chromatograms of selected characteristic tocopherol ions from clinical samples of men and women are shown in Figure 6, the distribution graphs of the obtained values are shown in Figure 7.
Fig. 4. The results of the obtained values of the content of three forms of tocopherol in clinical plasma samples.
| Sample 1: Female, age 44 | |
 |
 |
|
Sample 2: Male, age 38 |
|
 |
 |
| Sample 3: Male, age 52 | |
 |
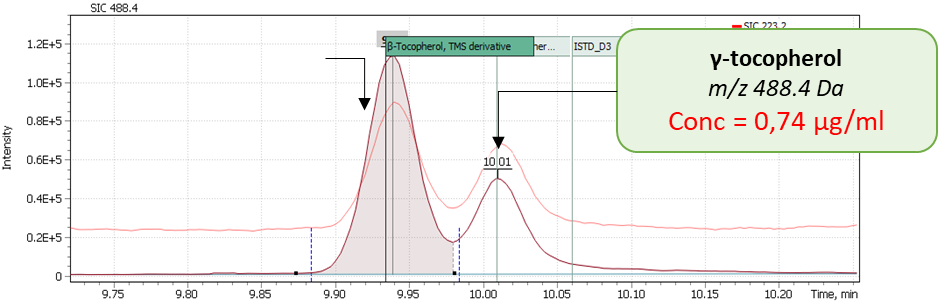 |
Fig. 5. Some statistics for 20 clinical samples, as well as the distribution of α, β and γ – tocopherols in human plasma samples (20 samples)
| Statistics: | Distribution of α-tocopherol, β-tocopherol, and γ-tocopherol concentrations in 20 human plasma samples. | |
 |
 |
 |
| α-tocopherol | γ-tocopherol | |
 |
||
| β-tocopherol | ||
The LOQ for tocopherol forms with Q-Tek single quadrupole mass detector were calculated using model calibration standards of the target compounds.
The LOQ for tocopherol forms with Q-Tek single quadrupole mass detector were calculated using model calibration standards of the target compounds.
| Overall assessment of method: | |||
| α-Т | β-Т | γ-Т | |
| · Linearity | |||
| R2 | 0.999 | 0.999 | 0.996 |
| · Calculated LOQs | |||
| Concentration, µg/mL | 2,85 | 0,06 | 0,03 |
Conclusion
As a result, a reliable and sensitive method for analyzing the main forms of vitamin E (tocopherol) in human plasma was developed. Liquid – liquid extraction of the compounds from the plasma allowed to gain a high degree of recovery of the components, while maintaining common sample preparation procedure for both the analysis of 25-hydroxyvitamin D3 and the analysis of tocopherol. Having one common and uniform sample preparation workflow is a cost-effective approach that may offer benefit for low and medium throughput private laboratories – for it reduces workload on laboratory staff along with risk of sample preparation errors.
The improved instrumental method using Q-Tek GC-QMS system could be used with high degree of confidence for daily monitoring of vitamin E level in human plasma, as well as to conduct large-scale studies of its correlation with various human health factors.
Literary References
- Е. Шастак, Р. Рюле. Роль витамина Е в кормлении животных и птицы, BASF SE, Германия
- Морозкина Т. С., Мойсеёнок А. Г. Витамины. — Минск: Асар, 2002. — С. 66 – 72.
- Regina Brigelius-Flohe, Maret G. Traber.VitaminE:functionandmetabolism(англ.). TheFASEB
- Evans H. M., Bishop K. S. On the existence of a hitherto unrecognized dietary factor essential for reproduction // Science. — 1922. — Вып. 56, № 1458. — С. 650 – 651. — doi:10.1126/science.56.1458.650. — PMID 17838496
- Bell, EF. History of vitamin E in infant nutrition (англ.) // American Journal of Clinical Nutrition. — 1987. — 46, no. 1. — P. 183 – 186. — PMID 3300257
- Regina Brigelius-Flohe and Maret G. Traber / Витамин E: функция и метаболизм. The FASEB 1999; 13:1145-1155
- Institute of Medicine. Food and Nutrition Board. Dietary Reference Intakes: Vitamin C, Vitamin E, Selenium, and Carotenoids. Washington, DC: National Academy Press, 2000
- Jiang Q, Christen S, Shigenaga MK, Ames BN. Γ-tocopherol, the major form of vitamin E in the US diet, deserves more attention. The American journal of clinical nutrition. 2001; 74:714–722. [PubMed: 11722951]
- Laboratory Medicine Best Practice Guideline: Vitamins A, E and the Carotenoids in Blood. Ronda F Greaves, Gerald A Woollard, Kirsten E Hoad, Trevor A Walmsley, Lambro A Johnson, Scott Briscoe, Sabrina Koetsier, Tamantha Harrower, Janice P Gill. Clin Biochem Rev 35 (2) 2014
- Distribution of tocopherols in human plasma and red blood cells. Ching K. Chow, Ph.D. The American Journal of Clinical Nutrition 28: JULY 1975, pp. 756-760
- Tocopherol, the major form of vitamin E in the US diet, deserves more attention. Qing Jiang, Stephan Christen, Mark K Shigenaga, and Bruce N Ames // Am J Clin Nutr 2001; 74:714–22.
- Γ-tocopherol – An Underestimated Vitamin? Karl-Heinz Wagner, Afaf Kamal-Eldin, Ibrahim Elmadfa. Ann Nutr Metab 2004; 48:169–188
- Traber MG, Kayden HJ: Preferential incorporation of α-tocopherol vs γ-tocopherol in human lipoproteins. Am J Clin Nutr 1989;49: 517–526.
- Lee R, Galli F, Kelly FJ: Á-Tocopherol metabolism and its relationship with α- tocopherol in humans; in Packer L, Traber MG, Kraemer K, Frei B (eds): The Antioxidant Vitamins C and E. Champaign, AOCS Press, 2003, pp 180– 194
- Bieri JG, Evarts RP: Tocopherols and fatty acids in American diets. J Am Diet Assoc 1973; 62:147–151.
- Dial S, Eitenmiller RR: Tocopherols and tocotrienols in key foods in the US diet; in Ong ASH, Niki E, Packer L (eds): Nutrition, Lipids, Health, and Disease. Champaign, AOCS Press, 1995, pp 327–342.
- Putnam JJ, Allshouse JE: Food consumption, prices, and expenditures, 1970–97. Washington, Food and Rural Economics Division, Economic Research Service, US Department of Agriculture, 1999 (Statist Bull No 965).
- FAO/WHO: Fats and oils in human nutrition report of a joint expert consultation. Food and Agriculture Organization of the United Nations and the World Health Organization. FAO Food Nutr Pap 1994; 57:1–147.
- Sanders TAB: Polyunsaturated fatty acids in the food chain in Europe. Am J Clin Nutr 2000; 71:176–178
- Block G, Norkus E, Hudes M, Mandel S, Helzlsouer K: Which plasma antioxidants are most related to fruit and vegetable consumption? Am J Epidemiol 2001; 154:1113–1118.
- Olmedilla B, Granado F, Southon S, Wright AJ, Blanco I, Gil-Martinez E, Berg H, Corridan B, Roussel AM, Chopra M, Thurnham DI: Serum concentrations of carotenoids and vitamins A, E, and C in control subjects from five European countries. Br J Nutr 2001;85: 227–238
- Ruiz Rejon F, Martin-Pena G, Granado F, Ruiz-Galiana J, Blanco I, Olmedilla B: Plasma status of retinol, ·- and Á-tocopherols, and main carotenoids to first myocardial infarction: Case control and follow-up study. Nutrition 2002; 18:26–31.
- Palli D, Masala G, Vineis P, Garte S, Saieva C, Krogh V, Panico S, Tumino R, Munnia A, Riboli E, Peluso M: Biomarkers of dietary intake of micronutrients modulate DNA adduct levels in healthy adults. Carcinogenesis 2003; 24:739–746.
- Kristenson M, Kucinskiene Z, Schafer-Elinder L, Leanderson P, Tagesson C: Lower serum levels of ß-carotene in Lithuanian men are accompanied by higher urinary excretion of the oxidative DNA adduct, 8-hydroxydeoxyguanosine. The LiVicordia study. Nutrition 2003; 19:11–15.
Tomasch R, Wagner KH, Elmadfa I: Antioxidative power of plant oils in humans: The influence of ·- and Á-tocopherol. Ann Nutr Metab 2001; 45:110–115.