The main purpose of vitamin D in the human body is to ensure absorption of calcium in the intestines and reabsorption of phosphorus in the renal tubules, to normalize formation of bone skeleton and teeth in children, and to ensure preservation of the bone structure. Vitamin D increases permeability of cell and mitochondrial membranes of intestinal epithelium, facilitating the TRANS-membrane transport of calcium cations and other divalent cations, activates the secondary absorption of phosphates, increases capture of these ions by bone tissue, and enhances ossification process.
The vitamin D group includes six sterols (vitamins D1, D2, D3, D4, D5 and D6), and two of them play a key role in the human body: vitamin D2 — ergocalciferol and vitamin D3 — cholecalciferol. Ergocalciferol (D2) is formed in plant cells from ergosterol and can only enter human body with food or dietary supplements. Cholecalciferol (D3) is mainly synthesized in humans in skin under exposure to ultraviolet rays of “B” range (UVB, 280-315 nm) and can also come from animal products [1].
Fig. 1. Structural formula of vitamin D3 (cholecalciferol)
Recent studies have shown the human body is not able to produce enough vitamin D3 just under exposure to sunlight, so it is very important to supplement vitamin intake through food [2]. In 2016, the U.S. Food and Drug Administration (FDA) revised its food labeling rules. Thus, the Agency has imposed guidance for clear indication and informing potential consumers about vitamin D content on food labels [3]. Changes to the labeling rules were aimed solely at raising consumer awareness of vitamin D3 [4].
Widely used method for analyzing vitamin D3 using liquid chromatography with a UV detector involves solid-phase extraction, purification, and multiple concentration of the sample. In such version of the method, the most challenging part of analysis is the presence of various interfering matrix signals, in particular, a large number of lipid-like compounds co-extracted with vitamin D3 (in spite of sample clean-up) may still lead to numerous chemical interferences that co-elute with cholecalciferol and may interfere with its quantitative determination [4].
The goal of this work was development of an easy method for routine analysis of vitamin D3 in milk using Q-Tek single quadrupole chromatography-mass spectrometry system (GC/MS).
Experimental part
Materials and methods
All reagents used in the experiment were classified as high purity or HPLC grade. The standard of the active substance cholecalciferol had a purity of at least 99.5%. Two types of commercially available milk from a local supermarket were obtained as the object of study, in particular, “fortified” milk (sample #1, lactose-free, milk fat content of 1.5%) and a regular milk (sample #2, milk fat content of 1.8%) not labelled as to have vitamin D3 supplement.
The following concentration points were used to build the calibration dependence: 0.022, 0.055, 0.11, 0.22, 0.55, 1.1 ppm (ng/µl).
Table. 1. Parameters of the instrumental method.
| Instrument | |
| GC-MS system model | Q-Tek GC-MS |
| Inlet | Trajan cat# 092001 Split (quartz wool) |
| GC column | Trajan cat # 054101 BP5X 5% Phenyl Polysilphenylene-siloxane 30m 0.25mm 0.25um |
| GC Method parameters | |
| Injected Sample volume | 1,0 мкл |
| Inlet mode | Splitless; hold 1.0 min, then purge at 50 mL/min |
| Inlet temperature | 280°C |
| Carrier gas flow mode | Constant Flow |
| Oven program | 120°C hold 1,0 min;
15,0°C/min to 300°C, hold 7,0 min; |
| Carrier gas flow and type | (He) 1,0 mL/min |
| GC-MS transfer line temperature | 250°C |
| Detector settings | |
| Ion source | EI |
| Ion source temperature | 230°C |
| Sovent delay | 12,0 min |
| SCAN parameters | SCAN 50 – 500 Da |
| SIM (see detail below) | |
| Dwell Time | 62 msec/ion (5 scan/sec) |
Overview of the method
An aliquot of 200 ml of milk was placed in a dark glass flask with a volume of at least 4 ml, 200 ml of acetonitrile was added to the aliquot to precipitate proteins and placed in a refrigerator for 10 minutes (temperature <4°C). Next, 1.0 ml of hexane was added to the cooled mixture, then the resulting bipolar mixture was shaken intensively on a laboratory vortex. To improve mixing, an orbital shaker was additionally used for 5 minutes at a rotation speed of 220 RPM.
At the end of the extraction stage, the mixture was centrifuged for 5 minutes at 3500 rpm then 0.7 ml of hexane (top layer) was transferred into a separate vial. The selected hexane aliquot was then dried at 69°C for 40 minutes in a heating block under exhaust hood.
Derivatization
50 µl of silylating reagent (100% MSTFA + 0.2% NH4I, v/w) was added to the dried residue, then, the vial was placed in a heating block for 40 minutes at 60°C. Finally, 1.0 µl volume of the resulting derivative was injected into a chromatograph. The parameters of the instrumental method used are shown in table 1.
Табл. 2. Retention time of the target ions peaks and their scanning parameters
| # | Target compound | Quantifier | Qualifier-1 | Qualifier-2 | RT |
| 1 | Cholecalciferol (D3) | 351,1 | 366,2 | 456,3 | 14,83 min |
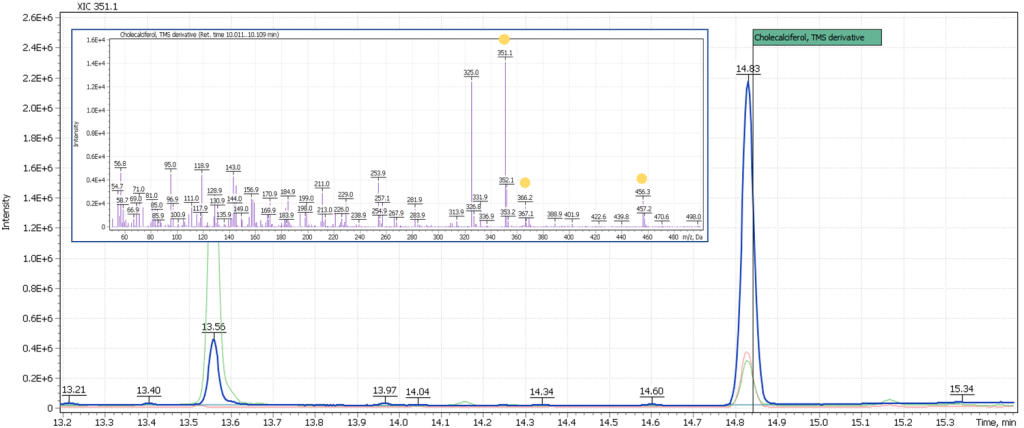
Fig. 2. Model chromatogram of the derivatized standard of cholecalciferol (SIM, 0.55 ppm concentration) and its mass spectrum (SCAN, 22.0 ppm concentration)
Results and discussion
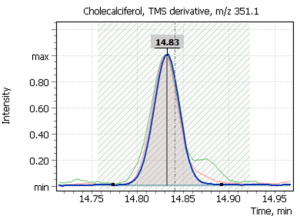
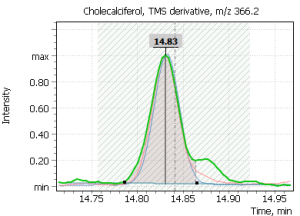
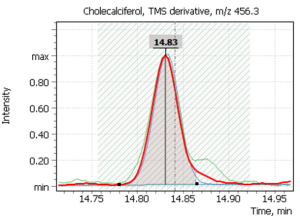
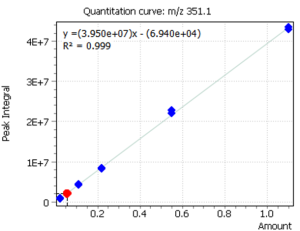
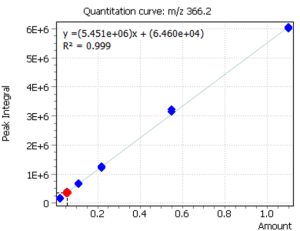
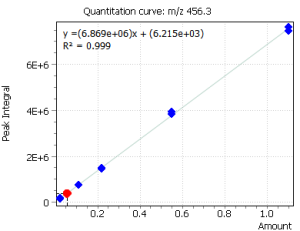
Quantitation of cholecalciferol was done by means of external calibration. Six calibration levels were used to construct the calibration dependence. At the same time, by using the “Flexible SIM” algorithm, calibration curves were automatically constructed for all target ions, which is clearly demonstrated in figure 3. The correlation coefficients for all ions were R2 ≥ 0.999.
The innovative “Flexible SIM” algorithm allows a user to select the optimal main ion for performing quantitative analysis after collecting mass spectrometric data. In particular, figure 3 clearly shows that the algorithm automatically integrates and builds calibrations for all ions selected for the target compound in the method. Thus, the user can switch from one ion to another during data processing, and thus to select optimal ion for given extracts of complex matrices by changing the main (quantitative) ion [5].
It is obvious that the “Flexible SIM” data post-processing algorithm can help to avoid time spent on instrument re-calibration but also provide support to the analyst in selecting the best structurally characteristic ions during development of instrumental method and performing subsequent analyses.
Fig. 3. Linear calibrations and signals of cholecalciferol target ions
| m/z 351.1 Da | m/z 366.2 Da | m/z 456.3 Da |
| – signal intensity at 0,055 ppm concentration | ||
 |
 |
 |
| R2 = 0.999 | R2 = 0.999 | R2 = 0.999 |
 |
 |
 |
Practical assessment of the method’s applicability
The method of routine analysis of vitamin D3 in milk using the single quadrupole chromatography-mass spectrometry system GC-MS (Q-Tek, Montenegro) was tested on two types of milk samples. In a sample of fortified milk (Approx. according to the product normalization, the vitamin D3 content is 2 µg/100 ml of the product), the vitamin D3 content was reliably recorded. Its concentration corresponded to that, specified on the milk packaging container:
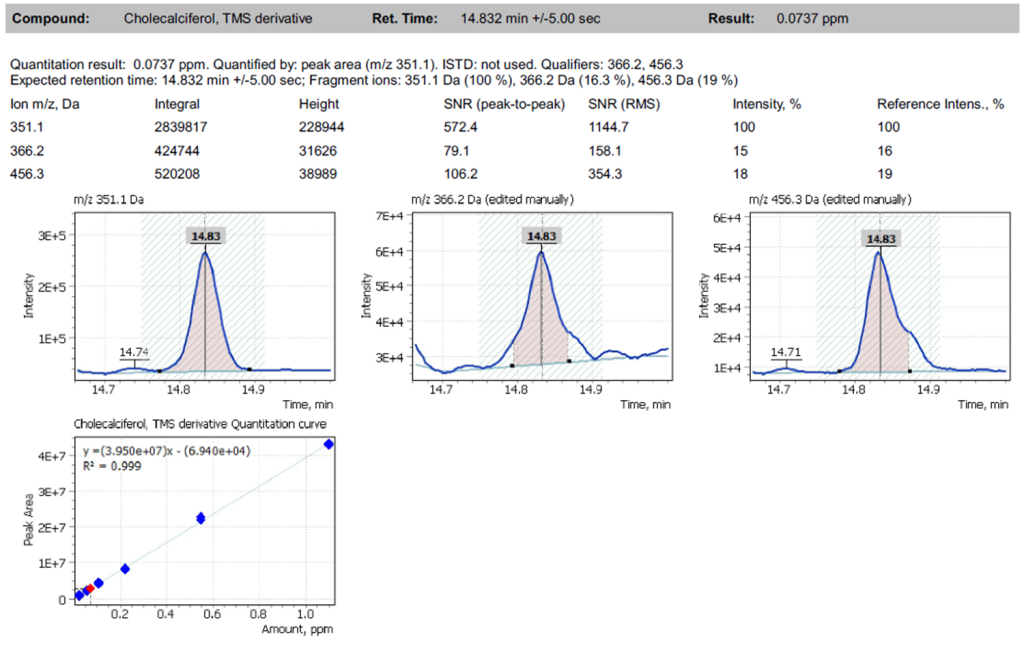
– 0.0737 ppm (ng/µl) measured well corresponded to 2 µg/100ml indicated on the product label when recalculated to the volume of the sample taken for the experiment.
Fig. 4. Extracted ion chromatogram EIC (SIM) of fortified milk (sample #1) and the quantitative analysis report sample
Figure 5 shows the mass chromatogram of a regular milk sample without additional fortification. The results of the analysis showed the absence of vitamin D3.
Fig. 5. EIC (SIM) mass chromatogram of milk sample #2
Figure 6 also shows a comparison of the target ion signals for milk sample #2 and the mass chromatogram of the same sample extract spiked with cholecalciferol. This figure demonstrates the correct detection of the signal and confirms the absence of vitamin D3 in a milk sample that does not have a special label for additional vitamin D3.
Fig. 6 Overlay of the EIC (SIM) mass chromatogram of the target cholecalciferol ion (361.2 Da) of sample #2 extract as is and sample #2 extract spiked with cholecalciferol
Conclusions
The results of the experiment demonstrate the possibility of using a chromatography-mass spectrometric system for the analysis of vitamin D3 (cholecalciferol) for quality control of dairy products. The method can be recommended for use in routine laboratories.
The chromatography-mass spectrometric system (Q-Tek, Montenegro) allows detecting cholecalciferol in a wide range of concentrations relevant to nutrition quality of milk. Furthermore, “Flexible SIM” data processing algorithm has proven to be of great help in quick and easy method development for reliable quantification of vitamin D3 supplement in commercial milk samples against the background of high-intensity matrix components.
Literature
- Holden, J.M. and Lemar, L.E., Am J Clin Nutr 2008; 88(supl): 551S-3S
- Food labeling: Revision of the nutritional and supplement facts labels, FDA, Federal Register / Vol. 81, No. 103/Friday, May 27, 2016 / Rules and Regulations
- Jinchuan Yang, Gareth Cleland, and Kari Organtini. Determination of Vitamin D and previtamine D in Food Products. Application Note. Waters Corporation, 720006064EN


