Vitamin D is a fat-soluble vitamin that differs from other vitamins in that its main source for the human body is conversion product of its precursor (7-dehydrocholesterol (previtamin D)) formed in the skin under ultraviolet radiation. Additional sources of vitamin D are foods such as high-fat fish, egg yolk, liver, dairy products, nuts, and others, as well as various dietary supplements.
The vitamin D group includes six sterols (vitamins D1, D2, D3, D4, D5 and D6), while two of them play a key role in the human body: vitamin D2 — ergocalciferol and vitamin D3 — cholecalciferol. These compounds are similar in chemical structure, insoluble in water, but well soluble in fat, and have similar stages of metabolism. Ergocalciferol (D2) is formed in plant cells from ergosterol and can only enter the human body with food or dietary supplements. Cholecalciferol (D3) is mainly synthesized in humans in the skin under ultraviolet radiation of “B” range (UVB, 280-315 nm) and can also come from food products of animal origin.
By themselves, vitamins D2 and D3 are biologically inactive, their biological effects come only after their metabolic transformations in liver into 25-hydroxy-cholecalciferol (25OH)D3) / 25-hydroxy-ergocalciferol (25(OH)D2) and with the participation of CYP27B1 (1α-hydroxylase) enzyme in kidneys into 1,25-dihydroxyvitamin D2 and D3, respectively. Despite the fact that 1,25-dihydroxyvitamin is the final and the most active metabolite of vitamin D, and specificity of its action is equal to the hormone (D-hormone), it is the total content of 25(OH)D metabolites that is considered the most accurate indicator of vitamin D level in human body, reflecting both level of its formation in skin (endogenous accumulation) and food intake (exogenous accumulation) [1]. This choice is also related to the fact that 25(OH)D is characterized by longer excretion half-time (about 3 weeks), compared to 1.25(OH)2D in circulating blood, which is also equally important in clinical practice [3].
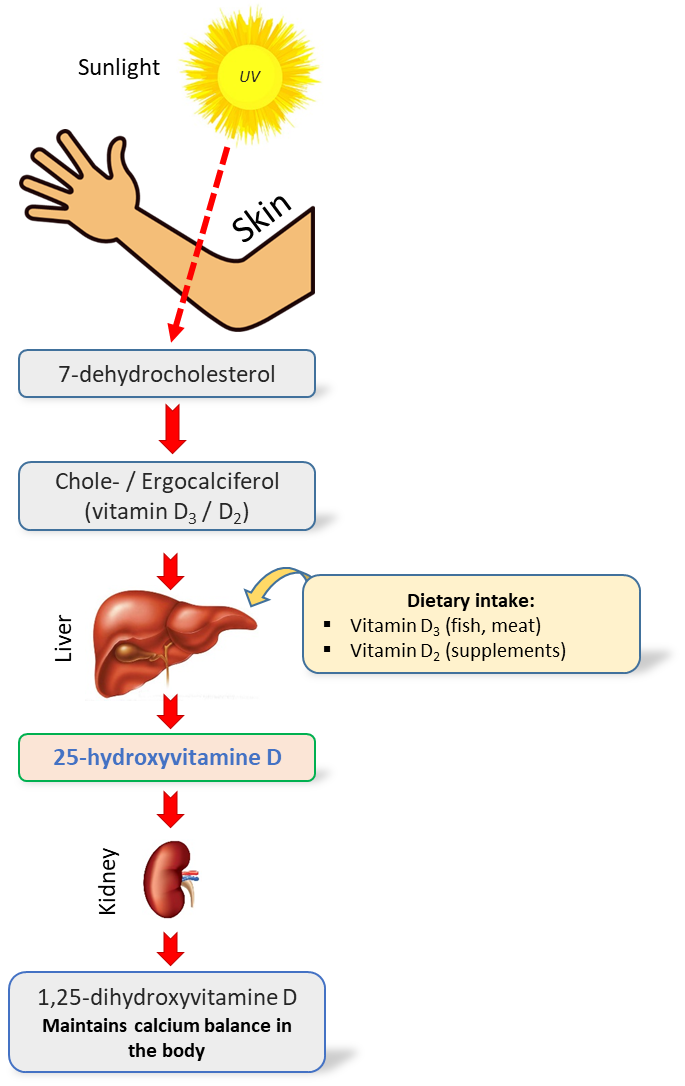
Fig. 1. Simplified scheme of vitamin D metabolism in the human body [2]
Table. 1. Forms and metabolites of vitamin D in the human body [29]
| Name of the metabolite | Effect | |
| 1 | D2 (ergocalciferol) | Enters the body with products of vegetable origin |
| 2 | D3 (cholecalciferol) | It is formed in the skin under UV-B radiation from 7-dehydrocholesterol precursor or enters the body with animal origin food products |
| 3 | 25(ОН)D3, calcidol,
(25-hydroxycholecalciferol) |
Liver-formed metabolite of vitamin D3, the main indicator of vitamin D supply status level |
| 4 | 1,25(ОН)2D3, calcitriol,
(1,25-dihydroxycholecalciferol) |
Kidney-formed vitamin D3 metabolite that provides the main biological effects of vitamin D (the D-hormone itself) |
Biological functions of vitamin D. Vitamin D promotes the absorption of calcium in the small intestine and maintains the necessary levels of calcium and phosphate in blood to ensure bone mineralization and prevent hypocalcemic tetany. Vitamin D is also needed for bone growth and bone remodeling, i.e. for proper osteoblasts and osteoclasts functioning. Sufficient level of vitamin D prevents development of rickets in children and osteomalacia in adults. Together with calcium, vitamin D is used for the prevention and complex treatment of osteoporosis [4-6].
According to a number of researchers, the functions of vitamin D are not limited only to the control of calcium-phosphorus metabolism. Vitamin D affects other physiological processes in the body, including cell growth modulation, neuromuscular conduction, immunity, and inflammation [7,5]. Vitamin D deficiency may impact immune system, since this vitamin plays the role of an immunomodulator [14], strengthening the innate immune system by increasing the expression and secretion of antimicrobial peptides [15-16], which increases the protective functions of the mucous membrane. In addition, a recent meta-analysis recorded the protective effect of vitamin D supplementation for respiratory infections [17-20].
Vitamin D greatly influences many processes in the body. Thus, it is one of the main substances that regulate the human immune system. At the same time, unlike medications that do not selectively affect the immune system, vitamin D inhibits autoimmune reactions and increases the body’s resistance to external and internal pathological influences. Vitamin D has an antiproliferative effect, that is, it inhibits the development of cancer processes in the body. It is proved elsewhere, in order to manifest its protective effect, the actual level of Vitamin D in blood measured as its transport form (25-hydroxycalciferol) must exceed reference values widely adopted by most routine clinical labs [28].
Numerous studies confirm the vitamin D effect on the reproductive system of men and women. That is why timely correction of vitamin D deficiency is of great importance in solving reproductive problems.
Vitamin D levels in human body. Vitamin D deficiency is a fairly common phenomenon, affecting, according to some estimates [12, 21, 22], up to a billion people on Earth. In the United States, according to a large population study conducted in 2001-2006, the prevalence of “risk of deficiency” of vitamin D in adults and children over 1 year was 8%. It can be added to 24% of people with the “risk of insufficient consumption” status [13]. Together, this is almost a third of the US population. In a number of other countries with sufficient levels of solar radiation, such as India, Pakistan, Iran, and China, a significant proportion of the population (according to some data, up to 60-80%) have symptoms of vitamin D deficiency [27]. Russia is located in a zone of low insolation, so almost all its inhabitants are at risk [11].
However, the given figures on occurrence of vitamin D deficiency may differ significantly based on particular level of 25-hydroxycholecalciferol in blood taken as the norm (16, 20 or 30 ng/ml or different) [9,7,10]. In 2010, the International Osteoporosis Foundation introduced a new classification of vitamin D status based on measured 25-hydroxycholecalciferol level in blood serum [9] (Table 2).
Table. 2. The classification of vitamin D level (25(OH)D) in the blood
| Vitamin D deficiency category | Level 25(OH)D (ng/ml) | Level 25(OH)D (nmol/l) |
| The risk of deficiency | < 12 | < 30 |
| Indication of insufficient consumption | 12 – 19 | 30 – 49 |
| Sufficient consumption | 20 – 50 | 50 – 125 |
| The level is too high to be a cause for concern | > 50 | > 125 |
Experts of the International endocrinological society are of the opinion that vitamin D deficiency is defined as a level of 25(OH)D in blood serum less than 20 ng/ml (50 nmol/l) [7]. According to the recommendations of “The Vitamin D Society”, the Canadian society of vitamin D experts, 40-60 ng/ml (100 – 150 nmol/l) of 25(OH)D in blood serum can be considered as optimal. Such concentration of 25(OH)D will most likely reduce risk of age-related diseases, such as osteoporosis, type 2 diabetes, various types of cancer, and increase longevity [8].
Excess of vitamin D is a rare phenomenon, mainly associated with the accidental or intentional intake of excessively large vitamin D quantity, which leads to hypercalcemia – an increased content of calcium in the blood. Long-term or chronic hypercalcemia, in turn, is fraught with calcification (calcification) of tissues, and this applies to such vital organs as the kidneys, heart, blood vessels, and lungs.
In addition, there is evidence that an increased concentration of vitamin D for a long time significantly increases cancer risks and affects mental and physical development in children.
Methods of vitamin D study. Currently, two types of analytical methods are used to monitor the level of vitamin D in human serum or plasma-an enzyme immunoassay and a method based on chromatographic separation followed by non-immunological detection [23].
The most common method is the use of tandem mass spectrometry with liquid chromatography (HPLC-MS/MS) [17,19]. The high selectivity and sensitivity of the method allows it to be used in routine clinical laboratories. At the same time, there is an annual increase in the use of this methodology in the laboratory sector [26]. On the other hand, cost of analysis, as well as ease of use of the method, are equally important issues in routine analyses. Simpler systems, such as gas chromatograph with single quadrupole mass detector, can significantly reduce the cost of performing a single analysis, while the selectivity and sensitivity of the system fully meets the required standards for monitoring the status of 25-hydroxyvitamin D in the human body. The use of this methodology in the literature is relatively rare. We were able to spot only few publications near the end of the 80th [24], as well as a modern review of Taiwanese specialists led by Ming-Yeh Yang and Ching-Yuan Huang [25].
The aim of this study is to develop a fast, sensitive and reliable method for determining the concentrations of 25(OH)D3 and 25(OH)D2 in human blood plasma for clinical evaluation of its status using the Q-Tek single quadrupole chromatography-mass spectrometric system (GC/MS).
Experimental
Materials and methods
Hexane, acetonitrile, ethanol, bidistilled water-all reagents used in the experiment were classified as particularly pure or “HPLC grade” quality. As a derivatization procedure, a silylation reaction was used to form trimethylsilyl derivatives using the MSTFA derivatizing agent in combination with ammonium iodide NH4I (the ratio of MSTFA/NH4I components is 100%/0.2% (v/w)). The internal standard used was the deuterated 25-hydroxyvitamin (6,19,19-d3) compound standards produced by Waters Corporation (MassTrak Vitamin D Kit Calibrator Set (p/n: 186008096IVD)). All works were carried out using dark (amber) glass phials to avoid possible degradation of the desired compounds (Fig. 4).
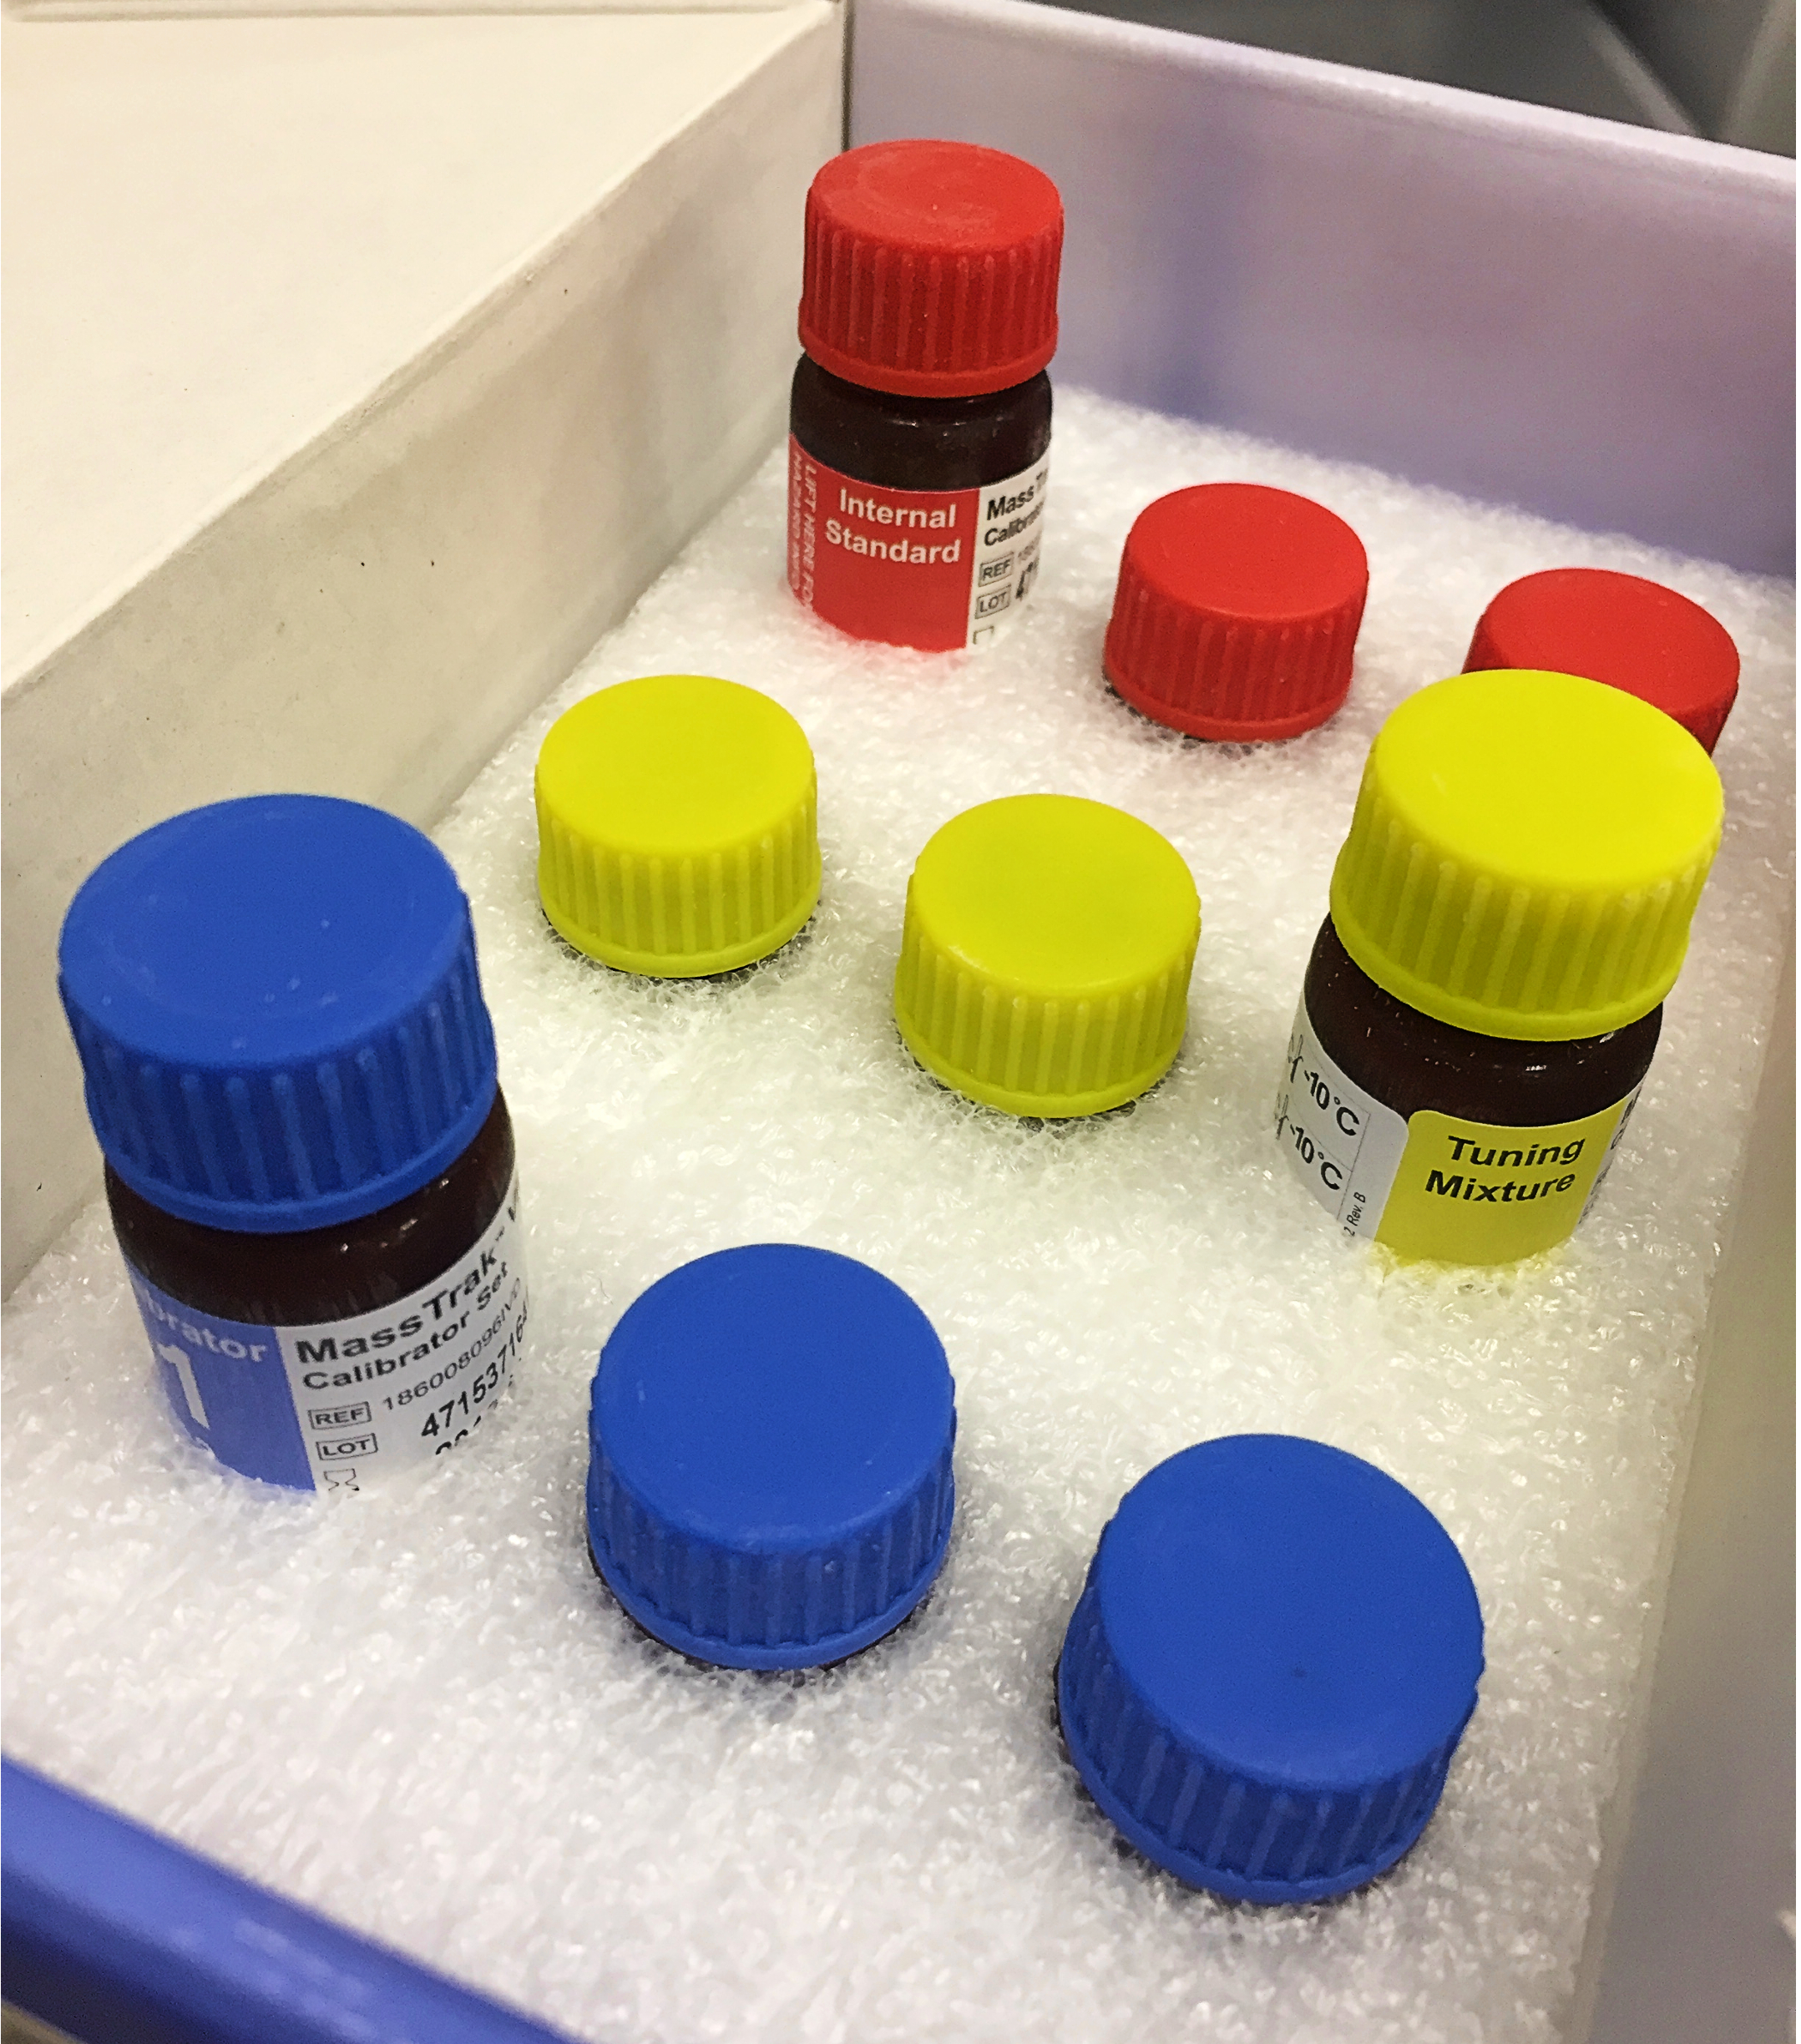
Fig. 2. Sets of model extracts from Waters
As calibration standards, the Waters Corporation – MassTrak Vitamin D Kit (p/n: 186008096IVD) was used, which includes various concentrations of vitamin D in dehydrated extracts of the model matrix. The linear range of the set is from 10 nmol/l to 375 nmol/l concentrations, for both 25(OH)D2 and 25(OH)D3 compounds. This wide linear range made it possible to completely cover all controlled categories of vitamin D sufficiency for a wide range of patients and exclude additional stages of concentration (or dilution) of the sample.
Model extracts from Waters Corporation (MassTrak Vitamin D Kit Quality Control Set (p/n: 186008097IVD)) were also used as standards for monitoring the compliance of the developed method with the requirements. They represent two control points for quantitative evaluation of the method, in particular, points with high concentrations of vitamin D2 and D3 in the sample (80 ng/ml and 92 ng/ml, respectively), as well as points with low concentrations (23.6 ng/ml and 26.1 ng/ml, respectively).
Procedure for blood collection and extraction of 25-hydroxyvitamin D
To test the method, we used samples of human blood plasma obtained from an accredited laboratory of the Institute of Analytical Toxicology. To separate the plasma, a standard method of centrifugation was used at a speed of 4000 rpm for 5 minutes. When immediate analysis was not possible, plasma samples were frozen or stored at -5°C to -18°C.
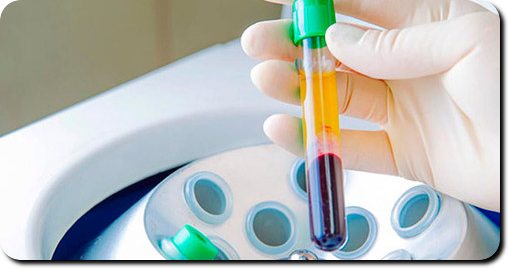
Fig.3. The separation of plasma by centrifugation
To perform the analysis, a plasma aliquot with a volume of 200 ml was used, which was placed in a 4 ml dark glass tube and 20 ml of an internal standard solution (in ethanol) was added to the test sample, after which 200 ml of acetonitrile was also added to the mixture. The resulting mixture was placed in a refrigerator at 4°C for 10 minutes to precipitate the protein (Fig. 4).
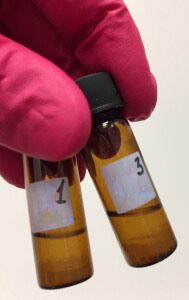 Fig. 4. Plasma extract after protein precipitation. The upper hexane layer
Next, 1.0 ml of hexane was added to the cooled mixture, after which the resulting bipolar mixture was shaken on a vortex. To improve mixing, an orbital shaker was used for 5 minutes at a rotation speed of 220 RPM. A layer of hexane (0.7 ml) was selected after centrifugation of the mixture for 5 minutes at a speed of 500 rpm. The resulting organic phase was dried using a thermostat at 69°C for 40 minutes.
Derivatization
50 µl of silylating reagent (100% MSTFA + 0.2% NH4I, v/w) was added to the dried residue, after which the vial was placed in a thermostat at 60°C for 40 minutes. The resulting derivative was injected into a chromatograph in a volume of 2.0 µl.
Gas chromatography and mass spectrometry
Mass spectra and signals of structural-characteristic ions were obtained on GC-MS system (Q-Tek, Montenegro).
The operating parameters of the chromatographic system and the operating modes of the mass detector are shown in table 3 and 4, respectively.
Table. 3. Parameters of the instrumental method
| Instrument | |
| GC-MS system model | Q-Tek |
| Inlet type and carrier gas mode | Split/Splitless, Constant Flow |
| Liner | Split, straight-through liner (Trajan cat # 092007) |
| GC column | Trajan cat # 054101 BP5X 5% Phenyl Polysilphenylene-siloxane 30m 0.25mm 0.25um |
| Method parameters | |
| Injected Sample volume | 2.0 uL |
| Inlet mode | Splitless mode |
| Inlet program | 1.2 min, then 50 ml/min |
| Carrier gas saving | 20 ml/min after 3.0 min |
| Inlet temperature | 280°C |
| Oven program | 150°C for 1,0 min;
10.0°C/min to 200°C, hold 0.0 min; 20.0°C/min to 290°C, hold 7.0 min; 5.0°C/min to 300°C, hold 2.0 min; |
| Carrier gas flow and type | (He) 1.0 ml/min |
| GC-MS transfer line temperature | 250°C |
| Detector settings | |
| Ion source | EI @ 230°C |
| Sovent delay | 10.0 min |
| SCAN parameters | 50 – 600 Da, 2000 Da/sec |
| SIM parameters | SIM (see Table 4) |
| Dwell Time | Automatically calculated by iDwell® Time algorithm, automatically time-segmented as below: |
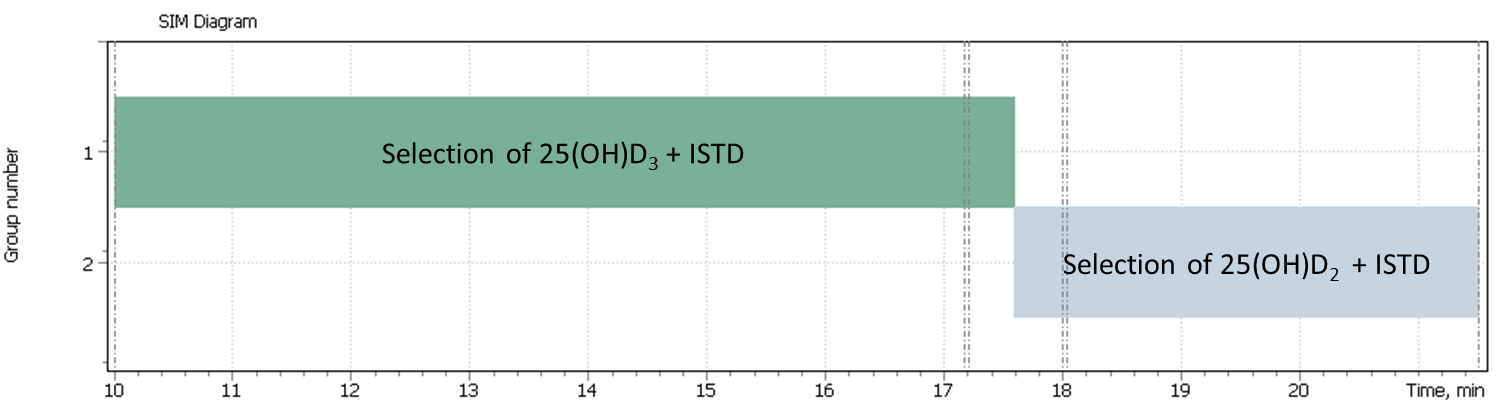
Table. 4. Retention Time of the target ions peaks and their scanning parameters
| № | Target compounds | Quantification
ion |
Qualification
ion 1 |
Qualification
ion 2 |
Elution time, min |
| 1 | 25-hydroxycholecalciferol (D3) | 544.4 | 529.4 | 413.4 | 17.20 |
| 2 | 25-hydroxyergocalciferol (D2) | 556.4 | – | – | 18.03 |
| 3 | 25-hydroxycholecalciferol_d3 (D3) | 416.4 | 532.4 | 547.4 | 17.17 |
| 4 | 25-hydroxyergocalciferol_d3 (D2) | 559.4 | – | – | 17.99 |
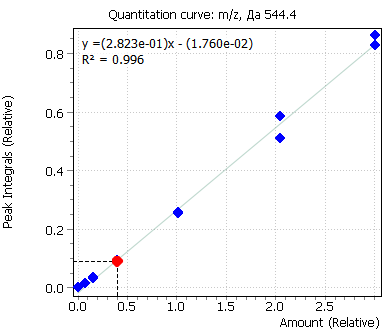
Linearity
Calibration curves for all analyzed compounds were built using commercial matrix standards MassTrak Vitamin D Kit Calibrator Set (Waters p/n: 186008096IVD). The concentration range for all compounds was in range from 0.0 nmol/l (0 ng/ml) to 370.0 nmol/l (150 ng/ml). The ratio of the compound peak area to the area of the internal standard peak was used to quantify the content of the compound in plasma.
| 25- hydroxycholecalciferol (D3) | 25- hydroxyergocalciferol (D2) |
 |
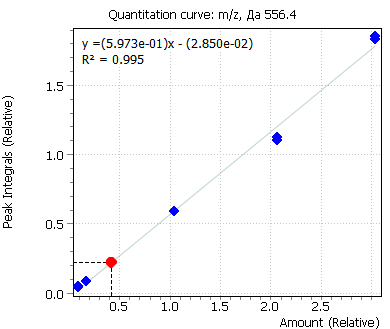 |
| 25- hydroxycholecalciferol (D3) | 25- hydroxyergocalciferol (D2) |
 |
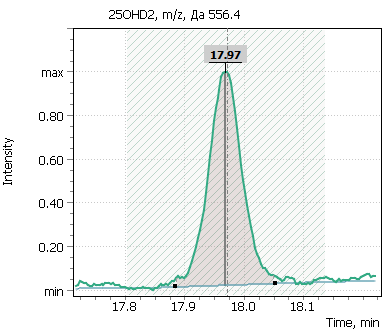 |
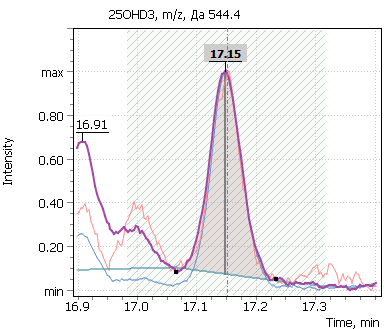
Fig. 5. Signals of target ions of vitamin D metabolites involved in the construction of calibration curves (concentration of compounds 20 ng/ml)
Discussion of the analysis procedure
25-hydroxycholecalciferol and 25-hydroxyergocalciferol are non-volatile molecules that cannot be analyzed in their native forms by GC-MS. To overcome this problem, non-volatile molecules need to be derivatized at specific functional groups to become non-polar volatile and GC-amenable.
To derivatize 25-hydroxyvitamin D silylation method was used, to convert the analyte into its trimethylsilyl derivative.
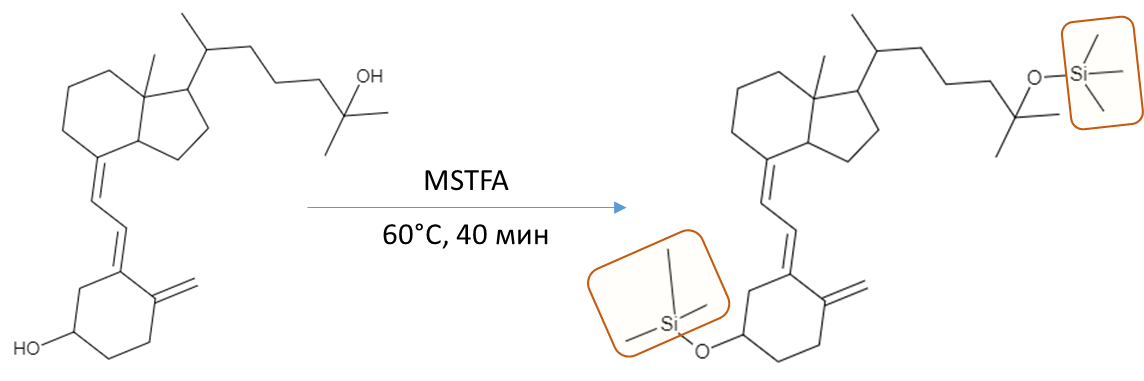
Fig. 6. 25-hydroxyvitamin D silylation stage
All silylating agents, including the MSTFA used, provide a sufficiently high sensitivity for determining the component. But this seemingly simple procedure also has its drawbacks, such as dramatic increase in the number of background compounds on the resulting chromatograms. These can be derivatives of organic polybasic acids, sugars, and other compounds that are widely present in biological matrix, which may just as well have become volatile after silylation, forming significant matrix effects on the chromatogram profile. Such increase in chemical noise complicates data processing later on and requires a careful optimization of the derivatization reaction temperature and time during sample preparation method development. To accomplish this task, it was proposed to use the results of Ming-Yeh Yang, Ching-Yuan Huang, and others [25], who demonstrated a complete derivatization reaction with MSTFA/NH4I (100:0.2%) mix accomplished in 40 minutes at 60°C.
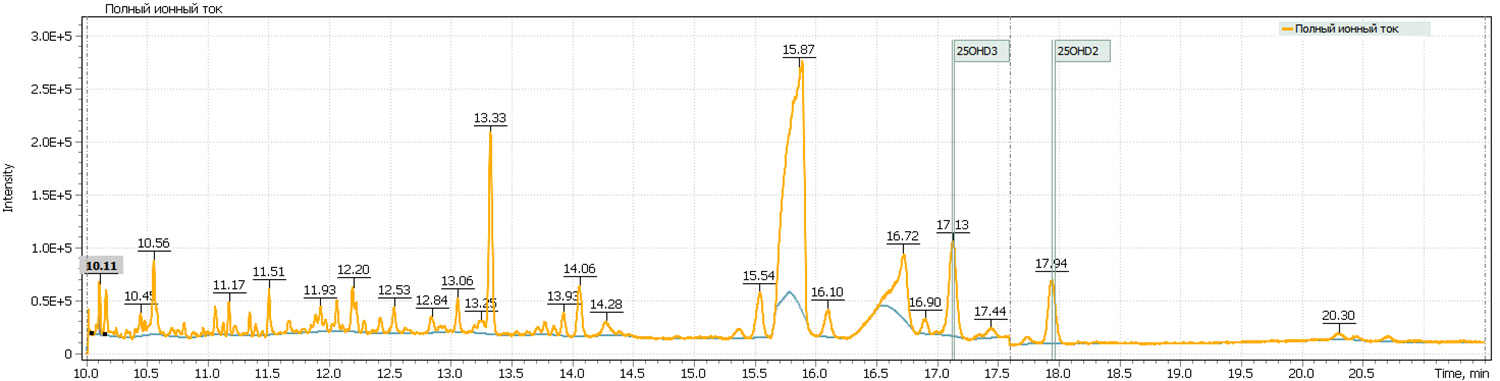
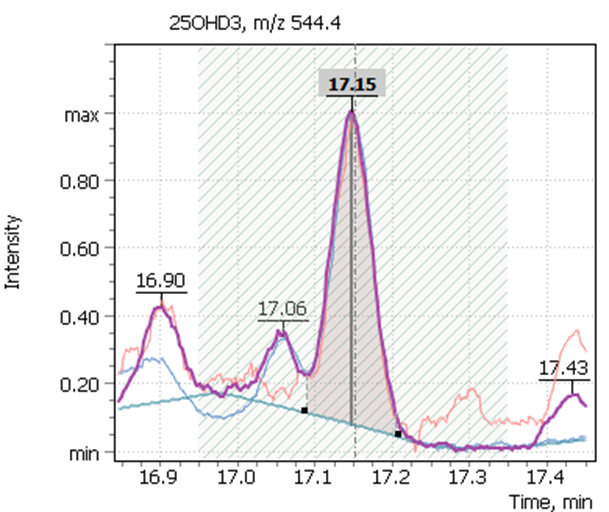
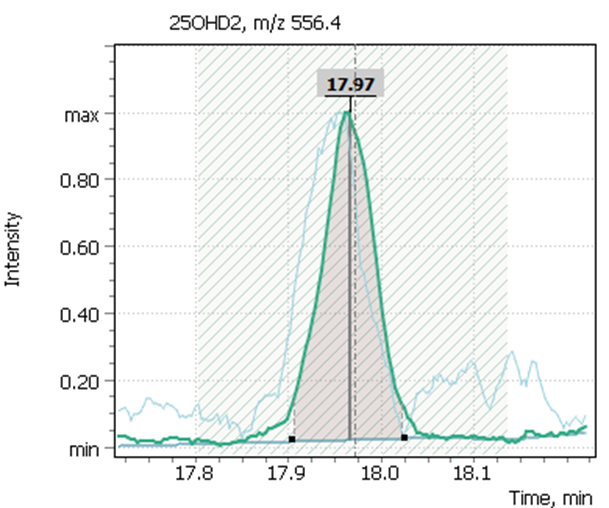
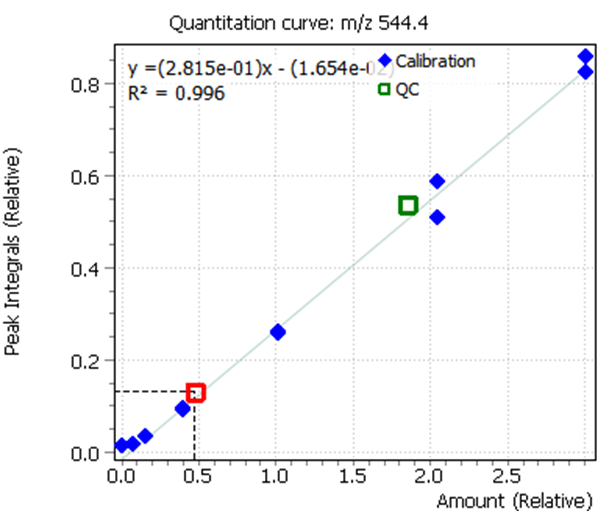
Figure 7 shows chromatograms of the total ion current and extracted ion currents of the target 25-hydrosivitamin D compounds of QC sample from MassTrak (Waters Corp.) kit. The QC samples are used to verify the correctness of the system calibration, as well as to control the performance of the analytical method. The Q-Tek GC-MS software allows a user to superimpose the results obtained from control samples on the calculated calibration curve and evaluate the accuracy of the analytical method (Table. 7 b,c).
Fig. 7. Testing of the method:
| – a) TIC chromatogram of a model plasma sample with a known 25-hydroxyvitamin content D (23.6 ng/ml (D3) / 26.1 ng/ml (D2)) | |
 |
|
| – b) Quant ion signals from model plasma samples | |
 |
 |
| – c) System calibration verification | |
| (green box □ – model plasma QC samples and their fit against earlier built calibration curve) | |
 |
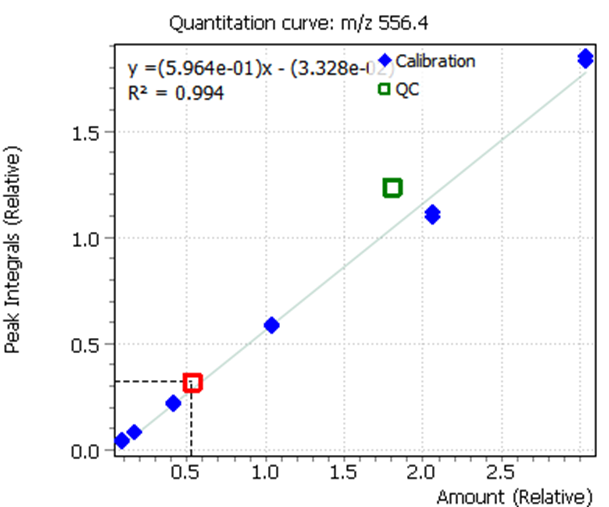 |
Table. 5. The analytical method characteristics based on method testing results
| Results of method validation: | ||
| 25(OH)D3 | 25(OH)D2 | |
| Low concentration level, ng/mL | ||
| Certified concentration value | 23.6 | 26.1 |
| Method accuracy, % | 105.0 (± 20%) | 107.1 (± 20%) |
| High concentration level, ng/mL | ||
| Certified concentration value | 80.0 | 92.0 |
| Method accuracy, % | 97.7 (± 20%) | 104.5 (± 20%) |
| Analytical method parameters: | ||
| 25(OH)D3 | 25(OH)D2 | |
| · Linearity | ||
| R2 | 0.996 | 0.995 |
| · Calculated LODs | ||
| Concentration, ng/mL | 12.04 | 15.2 |
The limits for detection of 25-hydroxyvitamin D using the single quadrupole mass detector was calculated using model calibration standards with known concentrations of target compounds.
Additionally, several tests of real plasma samples were performed. Samples were collected from men (2 samples) and women (2 samples) to monitor possible correlation of vitamin D intensity with the patient’s age. The obtained chromatograms are shown in figure 8 and demonstrate the peak of 25-hydroxyvitamin D to be well detected and reliably interpreted in a complex biological matrix under above described test method conditions. The peak has a good shape and is not affected by any matrix influences.
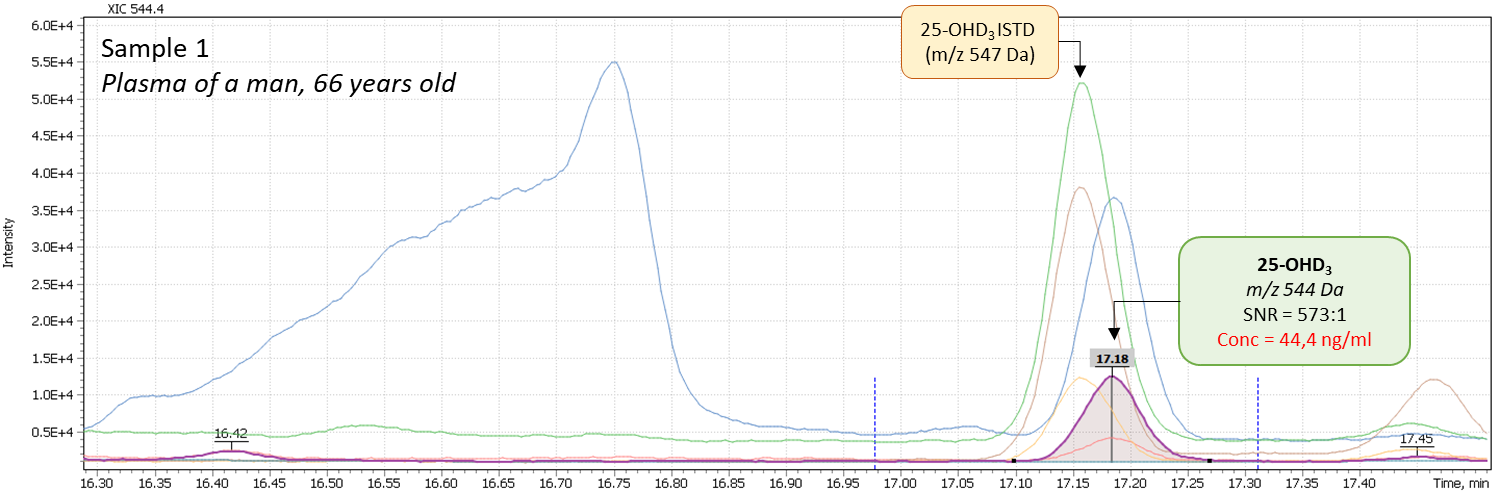
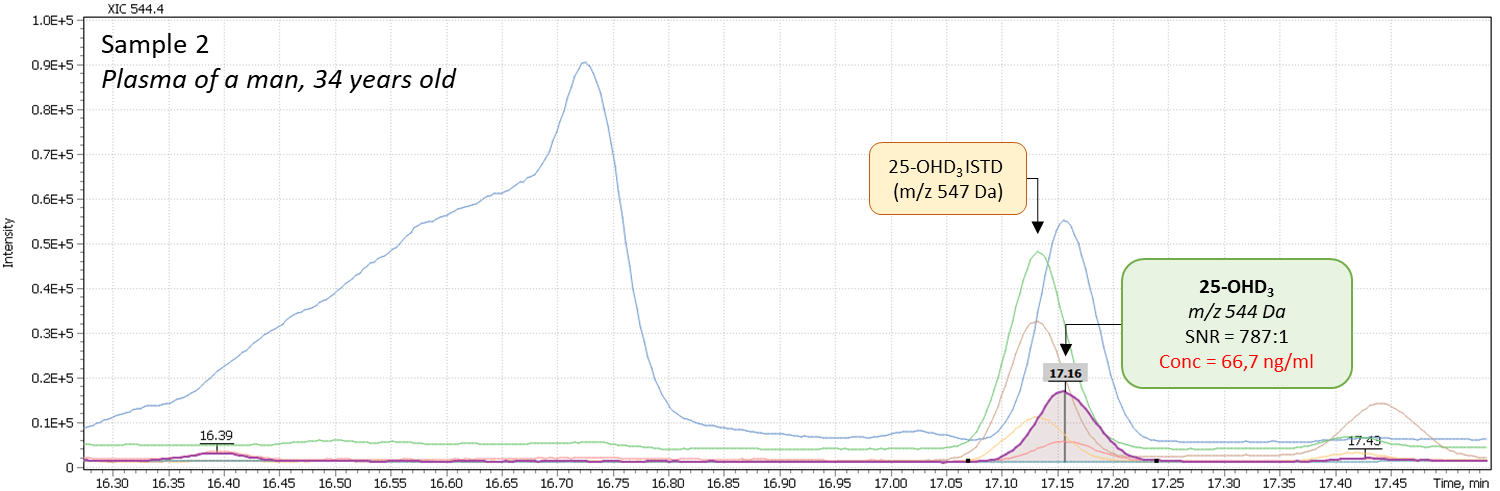
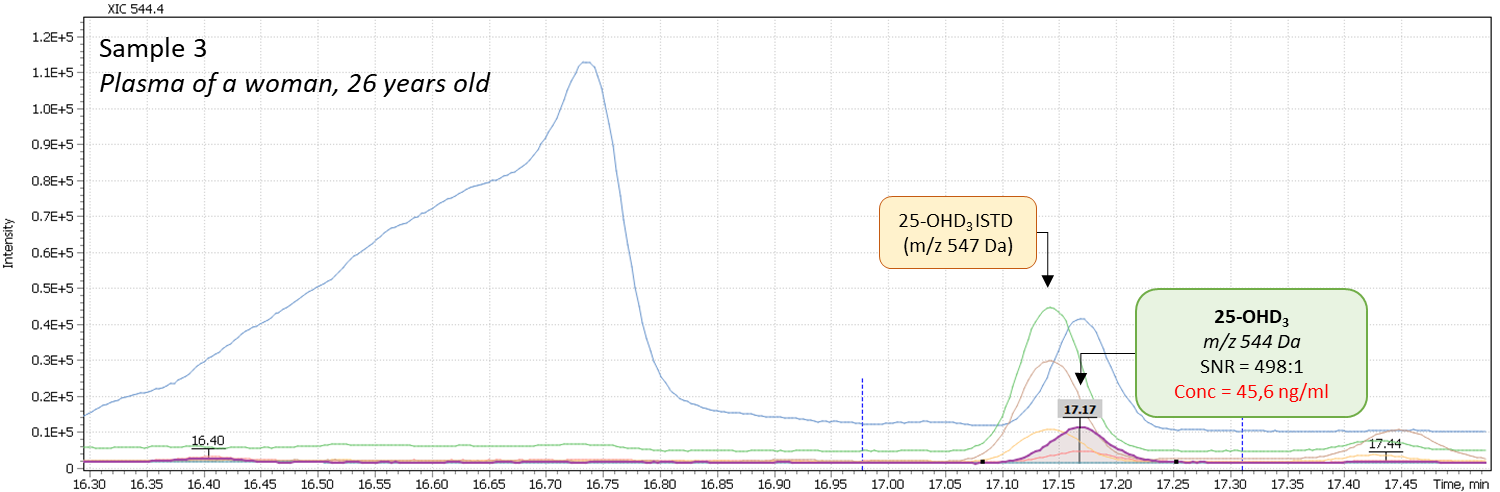
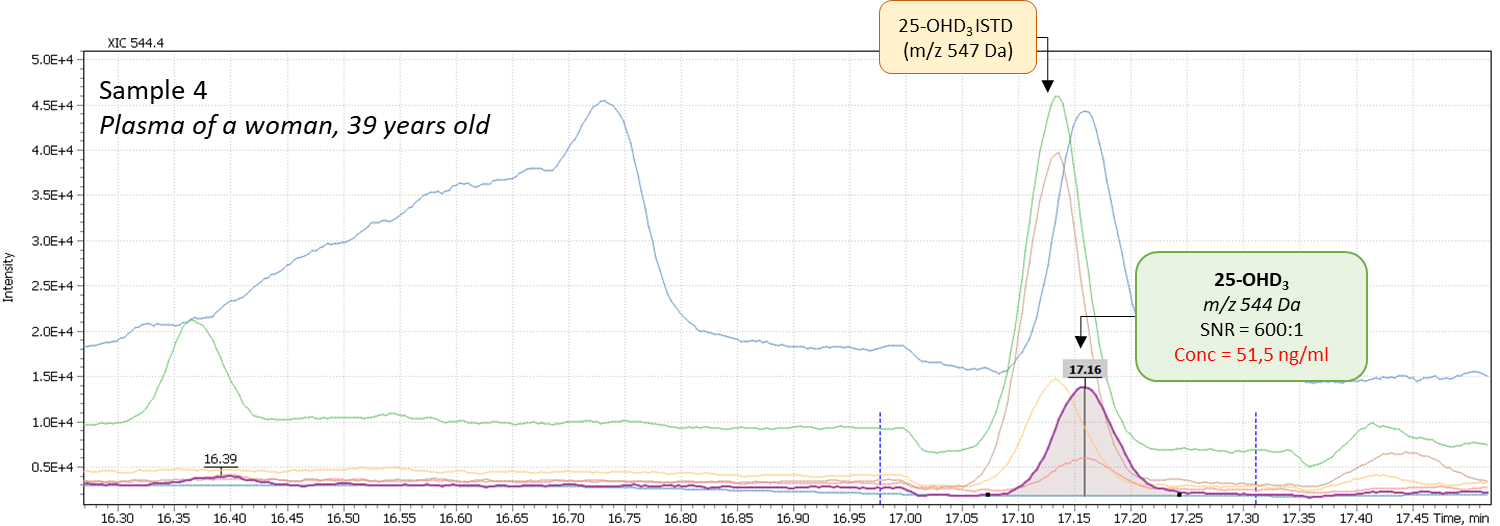
Fig. 8. Comparison of data from real plasma samples of men and women
Conclusions
As a result, a reliable and sensitive method for analyzing the main metabolites of vitamin D in human blood plasma was developed. Silylated derivatives of target compounds were obtained via specially developed derivatization protocol as to result in minimum number of derivative variants with good chromatographic properties. Liquid – liquid extraction of compounds from plasma was used to achieve a high degree of extraction of components.
Developed analytical method using the Q-Tek GC-MS mass spectrometric system (Q-Tek, D.O.O.) is suitable to a daily routine monitoring of vitamin D level in human blood, and conduct larger-scale clinical research aimed at study of perceived correlations of Vitamin D level with various human diseases including notorious COVID-19.
Literature
- Мальцев С.В., Мансурова Г.Ш., Метаболизм витамина D и пути реализации его основных функций. Практическая медицина 09 (14) Педиатрия (http://mfvt.ru/metabolizm-vitamina-d-i-puti-realizacii-ego-osnovnyx-funkcij/)
- Pepe J, Romagnoli E, Nofroni I, Pacitti M.T., De Geronimo S, Letizia C, et al. Vitamin D status as the major factor determining the circulating levels of parathyroid hormone: a study in normal subjects. Osteoporos Int 2005; 16:805e12.
- Jones K.S., Assar S, Harnpanich D, Bouillon R, Lambrechts D, Prentice A, et al. 25(OH)D2 half-life is shorter than 25(OH)D3 half-life and is influenced by DBP concentration and genotype. J Clin Endocrinol Metab 2014; 99:3373e81.
- Institute of Medicine, Food and Nutrition Board. Dietary Reference Intakes for Calcium and Vitamin D. Washington, DC: National Academy Press, 2010
- Калинченко С.Ю., Пигарова Е.А., Гусакова Д.А., Плещева А.В. Витамин D и мочекаменная болезнь. Consilium Medicum. 2012. Т. 14. № 12. С. 97-102.
- Cranney C, Horsely T, O’Donnell S, Weiler H, Ooi D, Atkinson S, et al. Effectiveness and safety of vitamin D. Evidence Report/Technology Assessment No. 158 prepared by the University of Ottawa Evidence-based Practice Center under Contract No. 290-02.0021. AHRQ Publication No. 07-E013. Rockville, MD: Agency for Healthcare Research and Quality, 2007
- Holick M.F, Binkley N.C, Bischoff-Ferrari H.A, et al. Endocrine Society. Evaluation, treatment, and prevention of vitamin D deficiency: An Endocrine Society clinical practice guideline. J Clin Endocrinol Metab. 2011;96(7):1911-1930.
- The Vitamin D Society. URL. http://www.vitamindsociety.org/benefits.php
- Dawson-Hughes B, Mithal A, Bonjour J.P, et al.: IOF position statement: vitamin D recommendations for older adults. Osteoporos Int 2010; 21(7): 1151-4
- Gómez de Tejada Romero M.J, Sosa Henríquez M, Del Pino Montes J, Jódar Gimeno E, Quesada Gómez J.M, Cancelo Hidalgo M.J, Díaz Curiel, Mesa Ramos M, Muñoz Torres M, Carpintero Benítez P, Navarro Ceballos C, Valdés y Llorca C, Giner Ruíz V, Blázquez Cabrera J.A, García Vadillo J.A, Martínez Rodríguez M.E, Peña Arrebola A, Palacios Gil-Antuñano S. Position document on the requirements and optimum levels of vitamin D. Rev Osteoporos Metab Miner 2011 3;1:53-64.
- Ziaee A, Javadi A, Javadi M, Zohal M, Afaghi A.Nutritional Status Assessment of Minodar Residence in Qazvin City, Iran: Vitamin D Deficiency in Sunshine Country, a Public Health Issue // Global Journal of Health Science. — 2013. — Vol. 5, iss. 1. — P. 174—179. — ISSN 1916-9736. — doi:10.5539/gjhs.v5n1p174.
- Vitamin D and Health | The Nutrition Source | Harvard School of Public Health
- Looker A. C., Johnson C. L., Lacher D. A., Pfeiffer C. M., Schleicher R. L., Sempos C. T.Vitamin D status: United States, 2001–2006. // NCHS Data Brief. — 2011. — March (№ 59). — С. 1—8. — PMID 21592422.
- Greiller C.L, Martineau A.R. Modulation of the immune response to respiratory viruses by vitamin D. Nutrients. 2015;7(6):4240-70.
- Wang T.T, Dabbas B, Laperriere D, Bitton AJ, Soualhine H, Tavera-Mendoza LE, et al. Direct and indirect induction by 1,25-dihydroxyvitamin D3 of the NOD2/CARD15-defensin beta2 innate immune pathway defective in Crohn disease. Journal of Biological Chemistry. 2010;285(4):2227-31.
- Gombart A.F, Borregaard N, Koeffler H.P. Human cathelicidin antimicrobial peptide (CAMP) gene is a direct target of the vitamin D receptor and is strongly up-regulated in myeloid cells by 1, 25-dihydroxyvitamin D3. The FASEB Journal. 2005; 19(9):1067-1077.
- Yakoob M.Y, Salam R.A, Khan F.R, Bhutta Z.A. Vitamin D supplementation for preventing infections in children under five years of age. Cochrane Database Systematic Reviews. 2016;11:CD008824.
- Bergman P, Lindh ÅU, Björkhem-Bergman L, Lindh JD. Vitamin D and respiratory tract infections: a systematic review and meta-analysis of randomized controlled trials. PLoS one. 2013;8(6): e65835.
- Charan J, Goyal J.P, Saxena D, Yadav P. Vitamin D for prevention of respiratory tract infections: a systematic review and meta-analysis. Journal of Pharmacology and Pharmacotherapeutics. 2012;3(4):300-303.
- Martineau A.R, Jolliffe D.A, Hooper R.L, Greenberg L, Aloia J.F, Bergman P, et al. Vitamin D supplementation to prevent acute respiratory tract infections: systematic review and meta-analysis of individual participant data. BMJ. 2017;356: i6583.
- Palacios C, Gonzalez L. Is vitamin D deficiency a major global public health problem? Journal of Steroid Biochemistry & Molecular Biology. 2014;144(2014):138-145.
- Wahl D.A, Cooper C, Ebeling P.R, Eggersdorfer M, Hilger J, Hoffmann K, Josse R et al. A global representation of vitamin D status in healthy populations. Archives of Osteoporosis. 2012;7(1):155–172.
- Snellman G, Melhus H, Gedeborg R, Byberg L, Berglund L, Wernroth L, et al. Determining vitamin D status: a comparison between commercially available assays. PLoS One 2010;5: e11555.
- Ruth D. Coldwell, Caroline E. Porteous, David J.H. Trafford, Hugh L.J. Makin. Gas chromatography—mass spectrometry and the measurement of vitamin D metabolites in human serum or plasma. Steroids Volume 49, Issues 1–3, January–March 1987, Pages 155-196
- Ming-Yeh Yang, Ching-Yuan Huang, Tina H.T. Chiu, Kai-Chih Chang, Ming-Nan Lin, Liang-Yü Che, Anren Hu. Using gas chromatography and mass spectrometry to determine 25-hydroxyvitamin D levels for clinical assessment of vitamin D deficiency. journal of food and drug analysis 27 (2019) 494 – 501.
- Yeung B, Vouros P, Reddy GS. Characterization of vitamin D3 metabolites using continuous-flow fast atom bombardment tandem mass spectrometry and high-performance liquid chromatography. J Chromatogr 1993; 645:115e23.
- Harinarayan C.V, Joshi S.R.Vitamin D status in India — Its implications and Remedial Measures // Journal of the Association of Physicians of India. — 2009. — Vol. 57, iss. January. — P. 40—48. — PMID 19753759.
- А. А. Гусова. Загадочный витамин D. https://proandro.ru/obrazovanie/biblioteka/
- С.Ю. Калинченко, М.И. Жиленко, Д.А. Гусакова, И.А. Тюзиков, Г.Ж. Мсхалая, К.С. Саблин, А.В. Дымова. Витамин D и репродуктивное здоровье женщин. Проблемы репродукции, 4, 2016
- Guidance Document on the Estimation of LOD and LOQ for Measurements in the Field of Contaminants in Feed and Food, 2016